TAPAS.network | 30 October 2025 | Commentary | Graham James
Revised values of travel time savings for road freight: what the new TAG says - and what it could mean

New valuations for time involved in transporting freight by road look set to increase the user benefits from interventions that aim to reduce congestion or shorten routes, and therefore increased benefit-cost ratios for these projects. looks at the proposed revised Department for Transport Transport Analysis Guidance on this subject and its background. He says that as most HGV traffic is on motorways and major A roads, these will generally be where the impact is felt most – especially on routes to major ports or warehousing and distribution areas.
What’s the issue?
The value of travel time savings (VOT, also known as VTT) for road freight is one of the long-standing loose ends in UK transport modelling and appraisal practice.
The existing approach in the Department for Transport’s (DfT’s) Transport Analysis Guidance (TAG) is based purely on the value of the driver’s wages and oncosts, plus an element of time-related vehicle costs that technically come under vehicle operating costs (VOCs). For example, the value in 2025 of an hour’s journey time saving for a lorry under the current formula is roughly £22 for the driver’s wages and oncosts, plus £4-£8 for the vehicle costs (2025 prices and values, factor cost unit of account). Other VOCs (fuel and distance-based costs) are separate to this.
But this doesn’t cover the full story. There are other matters not reflected in the current practice. For example, journey time savings may allow smaller fleets or wider coverage areas, and hence savings in depot or other overhead costs. And there is economic value in speedy delivery of the goods themselves. Value is lost from goods deteriorating or being stolen, capital is tied-up in transit, and consumers often choose to pay extra for next-day delivery. All these factors could flow through to journey time reliability valuations as well.
This matters at the sharp end. If you are developing a project aimed at reducing road congestion, or reallocating roadspace or kerbspace between freight and other modes, the existing practice means you will have impacts that aren’t currently being fully captured – particularly on the major roads where freight traffic is most significant.
Opening-up the too-difficult box
Tackling this has historically been left in the ‘too difficult’ box. The obvious approach is to carry out stated preference willingness-to-pay surveys, like we do with car users or rail passengers, to find out ‘from the horse’s mouth’ what these travel time savings are worth. There are practical challenges in doing this with the freight sector, with its diversity and the need to engage with businesses; you can’t just go and ask people on the street.
Freight was therefore not covered in the last major update of UK value of time in 2014/15, which dealt only with passenger trips. But the issue has continued to bubble-under. And research overseas has offered some techniques to try, and some valuations that we can use as sense-checks.
The DfT’s 2019 Appraisal and Modelling Strategy decided to take the plunge and commission research. It’s taken a while for this to come through. Covid-19 put surveys on hold for a time. And DfT have sensibly spent time getting peer-challenge on the results, and thinking-through for themselves in what is a tricky technical area.
This month, they finally published their proposed way forward, including the new valuations and how these would feed into TAG and the TUBA software. They also published the underlying research study and the to-and-fro of the peer challenge.
The research, titled ‘Freight value of time and value of reliability’, was commissioned jointly by DfT and National Highways. It was produced by Arup, Aecom, the University of Leeds and Significance. The peer review was by Ian Williams.
The new approach isn’t going live quite yet. DfT is seeking stakeholders’ feedback on the proposals until 7 November. An engagement event was also due to be held on 30 October, just after this issue of LTT is published.
A subsequent Forthcoming Change notice will set out the finalised approach, ahead of new guidance going live in May 2026.
What are the elements of the valuation?
There are four potential elements of the proposed new valuation:
-
The driver’s wages and on-costs. This is captured in the current TAG VOTs. For light goods vehicles (LGVs), this also applies to any other occupants of the vehicle.
-
The capital asset cost. This is currently captured in the vehicle operating costs (VOCs) as non-fuel time-dependent costs – the ‘b1 parameter’ – rather than in the VOTs.
-
Other potential costs to the carrier (haulier), such as depot costs. Although these are fixed in the short-run, changes to journey times and fleet requirements can affect them in the long-run. Essentially this is the value of logistical efficiencies from regularly making quicker journeys. It is not captured in the current valuation method.
-
The goods themselves –the economic cost (or value lost) of each hour they spend in transit. Again this is not currently captured.
The first three of these are called ‘carrier’ costs, because they are borne initially by the carrier. The last one is called the ‘shipper’ cost, because it is borne initially by the shipper (the carrier’s customer). It doesn’t apply to empty runs. The carrier and shipper categories can overlap in practice – for example, if there are contractual penalties for late delivery.
The research covered both carriers and shippers. They were asked about the journey time and cost of their typical journeys, then given a stated-preference ‘choice game’ to understand how they would trade off between these factors.
DfT has reported the results in 2022 prices and values. I will do the same for simplicity, but remember these will differ from the 2010 or 2023 prices and values that we more often quote.
What the survey found….
Heavy goods vehicles
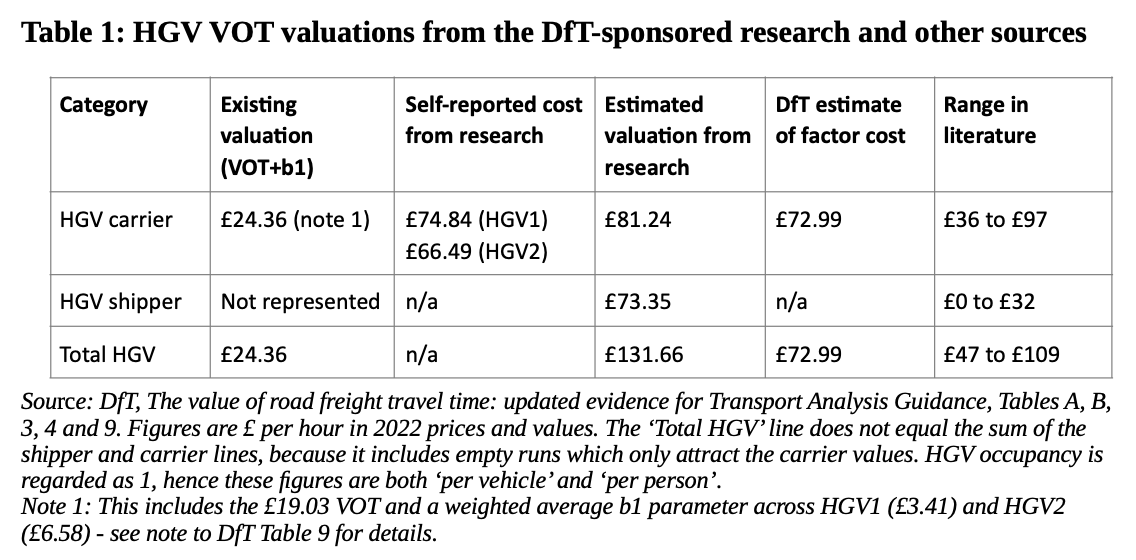
All heavy goods vehicle (HGV) movements are ‘freight’ for modelling and appraisal purposes, which keeps things simple. Table 1 shows the survey results for HGVs, plus the existing valuations and two ‘sense-check’ measures as reported by DfT.
The estimated value to carriers was around £81 per hour – more than three times the current valuation of around £24 per hour. It meshed well with the costs that carriers reported in the same research, and was within the range of valuations seen in the literature from other countries’ studies. As a further sense-check, DfT made their own bottom-up estimate of the cost of an HGV trip, using published industry data, which came out similarly. So far, so good.
The shipper valuation was more puzzling. The figure of around £73 was much higher than expected, and well above the range seen in the literature. It represented around 40% of the combined total, much more than the 15% seen elsewhere. DfT says the reasons for this unexpected result are unclear, but may partly be down to the experimental design.
A further snag is DfT’s suspicion – based on the numbers – that the carriers may have been including some shipper valuations in their responses, despite being asked not to. If so, there is a risk of these being double-counted if the carrier and shipper figures are both used. Other countries’ studies have also identified this risk.
For these two reasons, DfT are proposing to use the £81 carrier figure alone (which may include an element of the shipper value) as the new HGV value of time. They see this as the more conservative approach. The b1 parameter in the VOCs would be removed for these trips, as what it represents is subsumed in the new VOT figure.
The current TAG advice to modellers is to double the HGV VOT for assignment purposes, reflecting the limitations of the current valuation. This advice becomes redundant and will be withdrawn.
Light goods vehicles
For LGVs, the same basic approach is used, but there are complications. Unlike the assumption for HGVs, LGV traffic has a range of journey purposes, as highlighted in LTT last year by Professor Phil Goodwin (LTT 891, 8 May 2024, and on the TAPAS network). Not all trips count as working time, and most of that is ‘services’ (eg tradespeople) rather than freight. The calculations also need to reflect LGV occupancy being greater than one person.
On the carrier side, the survey estimated both cost and VOT figures of around £60 per hour for LGVs (Table 2). DfT sees benchmarking of these figures against the literature as difficult, as different studies use different definitions and methods for the LGV figures. But they can still be compared against a bottom-up cost estimate. The figures from the survey were more than twice this estimate, which raised question marks. DfT considers the small sample size to be the likely issue here.
The shipper side also raised practical concerns over the method and the small sample size, and in the end a shipper VOT could not be robustly estimated.
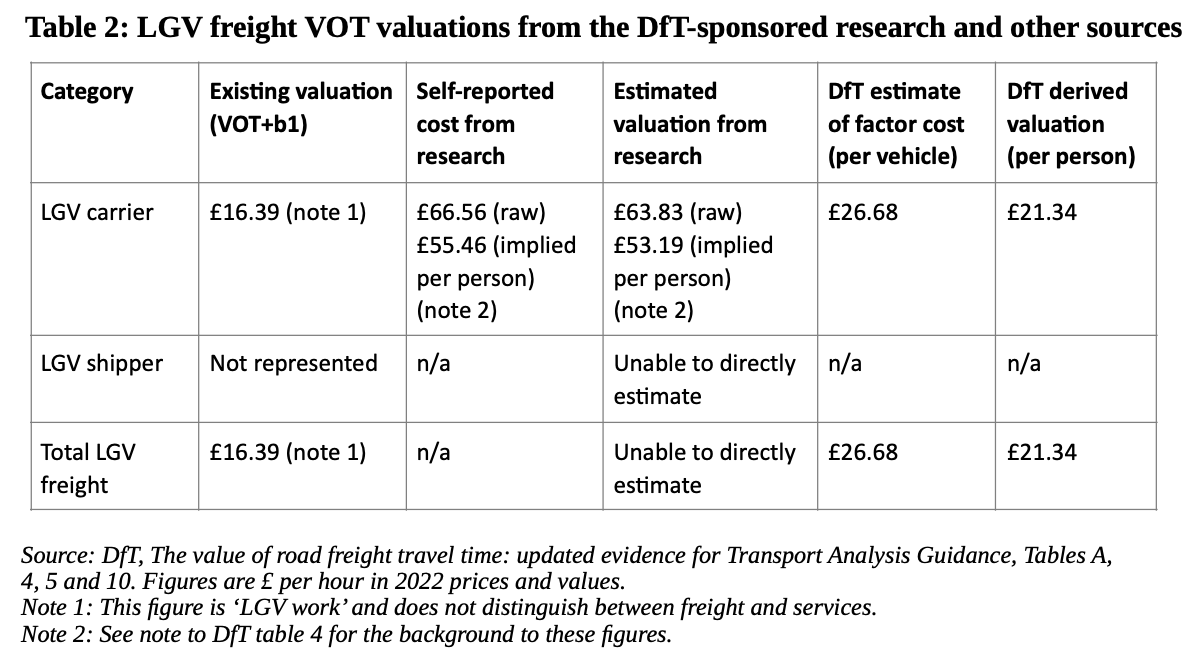
So DfT are not planning to adopt the LGV element of the survey results. But they are keen to improve on the current method and to be consistent with the proposed approach to HGVs. The proposed new VOT for LGV freight is therefore based on the bottom-up cost estimate, scaled from ‘per vehicle’ to ‘per person’ in line with the TAG convention. It increases from around £16 to around £21. This does mean, however, that the ‘shipper’ element of VOT is still not captured for LGVs.
Trips to ports
The research also looked at whether trips to ports had different valuations from other freight trips. For this purpose, ‘ports’ included airports, the Channel Tunnel and rail freight interchanges as well as seaports.
Although the survey indicated a higher valuation for port trips, this was only statistically robust for the shipper valuations, in which DfT had low confidence as described above.
There is also a practical snag. The interest in ports reflects the issue that missing a sailing (or flight or train) creates extra delay and hence cost. But as Williams pointed out, most HGV seaport trips are unaccompanied freight, meaning that trailers are dropped-off over time, ready to be placed on the ship later, and missing a sailing does not incur extra driver wage costs. So the right weighting between accompanied and unaccompanied freight would be needed, and this was not covered in the survey.
For these reasons, DfT is not proposing separate ‘to port’ valuations.
The bottom line
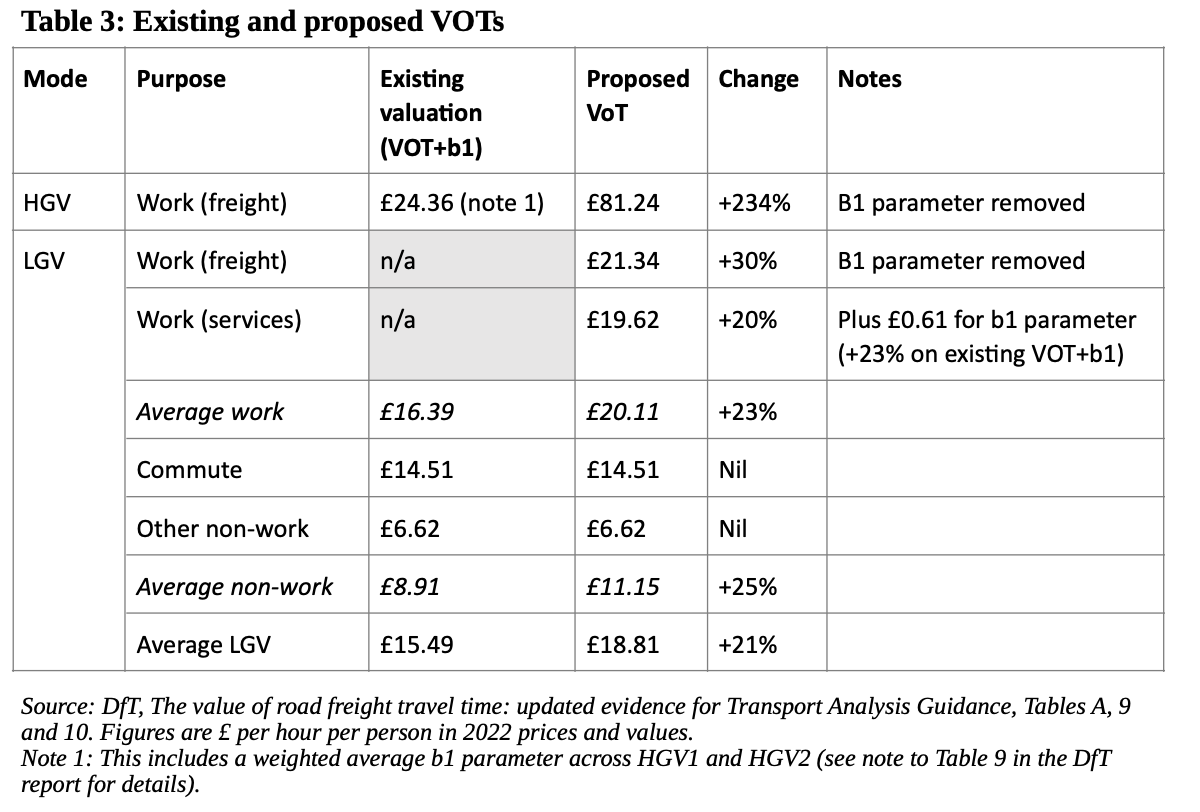
So where have the values ended up? Table 3 sets out the position. On an apples-to-apples basis, taking account of the element that currently appears in VOCs rather than VOTs, the value of time for HGV trips has more than tripled. The increase for freight LGV trips is less dramatic, but still considerable at 30%.
Journey time reliability
As well as the time savings themselves, the survey also looked at the value carriers and shippers put on journey time reliability (JTR, also known as VTTR).
The TAG method of valuing road JTR uses a parameter called the ‘reliability ratio’ (RR) which essentially says how the value of JTR relates to the basic VOT for a particular mode and purpose. As a practitioner, you don’t need to know the JTR values themselves – you just multiply the relevant VOT by the relevant RR. The research feeds into updated RRs.
Currently, TAG recommends an RR of 0.4 for all journey purposes by car, and has no recommendations for HGVs or LGVs. The MyRIAD tool, used for assessing JTR on the strategic road network, uses 0.4 for LGVs and 0.6 for HGVs.
The survey results for HGVs had a similar issue with the shipper valuation on JTR as on the basic VOT. But DfT is happier with the carrier valuation. It indicated an RR of 0.58, close to the MyRIAD value, and this will now be the TAG recommendation. Because the RR is applied to the basic VOT, which has now tripled, the monetised JTR benefits will increase too.
For freight LGVs, DfT has taken what it can from the survey data, and is proposing an RR of 0.70. JTR benefits for LGVs are rarely split by purpose, so DfT is proposing an RR for average LGV of 0.47. This is an increase over the existing MyRIAD value, and will be again magnified by the increase in the basic VOT.
Other matters arising
The new approach has added some downstream complications.
Firstly, the existing LGV ‘work’ journey purpose needs to be split into ‘freight’ and ‘services’, in order to apply the new freight VOT where it belongs and to subsume the existing b1 VOC parameter for the relevant trips. The LGV ‘services’ VOT retains the same method as the existing ‘work’ VOT, but updated to reflect latest wage costs. Services trips and non-work trips will retain the b1 parameter within VOC.
DfT has also taken the chance to update the vehicle-km split of work, commuting and ‘other’ LGV journey purposes. This in turn affects average LGV occupancy values, which will increase slightly (see Table 8 of the DfT document).
There are also impacts on how VOTs are uprated for future years to reflect real-terms economic value. The current approach uses the historic and forecast growth in GDP per capita for all vehicles and journey purposes (a smoothed-out version of the forecast is used in appraisal). The new, more complicated road freight VOTs will get their own time-series that blend real-terms wage growth for the wage elements with real-terms constant values for the rest (Table 4).

Finally, these changes are all about road traffic. Modelling and appraisal of rail, maritime and aviation freight tends to have its own methods, and DfT doesn’t propose to change the advice on them. But there will be a minor linkage. The road traffic decongestion benefits of modal switch to these other modes are often captured through the Marginal External Cost (MEC) methodology, which takes account of the benefits of quicker journeys for the remaining road users. As with JTR, the increased values of time will flow through into increased MEC valuations.
What it means for appraisal results
In general, the new valuations will lead to increased user benefits from interventions that aim to reduce congestion or shorten routes, and therefore increased benefit-cost ratios for these. Most HGV traffic is on motorways and major A roads, and these are generally where the impact will be felt most – especially on routes to major ports or warehousing and distribution areas. LGV traffic is much more diffuse, but there will still be concentrations of freight trips (albeit a minority of the LGV total).
DfT estimates that the average VOT across all traffic will increase by a range of 15-40%, with motorways at the top of this range and minor rural roads at the bottom.
In appraisal terms, the impact on total benefits and BCRs will of course vary depending on the project. But in a typical road scheme, user benefits are the biggest single category of benefit and time savings are the lion’s share of that. (There will also be some switching of impacts from VOC to VOT categories as the freight b1 element moves across.).
There will be a consequential bonus increase if JTR is being monetised. And if, under the wider economic impacts heading, output change in imperfectly competitive markets is being monetised through the basic TAG method of uplifting the business and freight user benefits, then there will be a bonus here too.
Some conclusions
This review and the proposals arising from it are a welcome development to tackle a long-standing, narrow but significant limitation of current practice in one of the core areas of transport appraisal.
I’m pleased to see the research, the subsequent peer-review process and the DfT’s own thought and effort that has clearly gone into making the best of the evidence. Also welcome are the transparency over the level of confidence in the evidence, and the DfT’s openness to views before incorporating the new approach into TAG.
There will doubtless now be a lot of comment and interest from the specialists in this area. The acid test is not so much whether these new values are exactly right, as whether they are more right than the old ones. DfT have made a strong case for why they are.
As the proposals stand, there will be a big change to freight values of time, especially for lorries. These will go a long way to addressing the known issue. There is still work to do on the trickier aspects, particularly to fully reflect the ‘shipper’ element representing the economic value of speed-of-delivery, or hitting particular delivery windows, over and above the direct transport costs. But it’s a major step forward.
The new approach does add some complications that practitioners will need to watch out for. In particular, uprating values of time for future years will become more complicated (other than in TUBA which will do it for you), with new time-series for different vehicle types in different situations. As always, it’s important to understand which sets of figures you are using, and why.
References and Links
-
DfT, The value of road freight travel time: updated evidence for Transport Analysis Guidance, https://assets.publishing.service.gov.uk/media/68f8aa2180cf98c6e8ed8f5f/value-road-freight-travel-time.pdf
-
The deep flaws in how we model freight, Phil Goodwin TAPAS.network
Graham James is a Technical Director at the transport planning consultants Galle Saliman and Parking Perspectives. He studied geography and began his career on the policy and research staff of the London Regional Passengers Committee (now London TravelWatch), before moving into the consultancy sector. He is a Treasury-accredited Better Business Cases practitioner and he lectures in Transport Economics.
This article was first published in LTT magazine, LTT925, 30 October 2025.
You are currently viewing this page as TAPAS Taster user.
To read and make comments on this article you need to register for free as TAPAS Select user and log in.
Log in