TAPAS.network | 30 October 2025 | Commentary | John Siraut
Latest National Travel Survey reveals significant shifts in how and why we move around

Ongoing changes in the patterns of travel behaviour in England are indicated in the release of the 2024 National Travel Survey results, recently published. Year-on-year differences may be small, but they are significant, says who has dug into the data.
THE LATEST EDITION of the English National Travel Survey , published in August, includes so much interesting and revealing data it’s difficult to know where to begin or what to highlight. But both high level and detailed changes revealed by this annual household sample survey are potentially significant, so we should look hard at them as transport professionals.
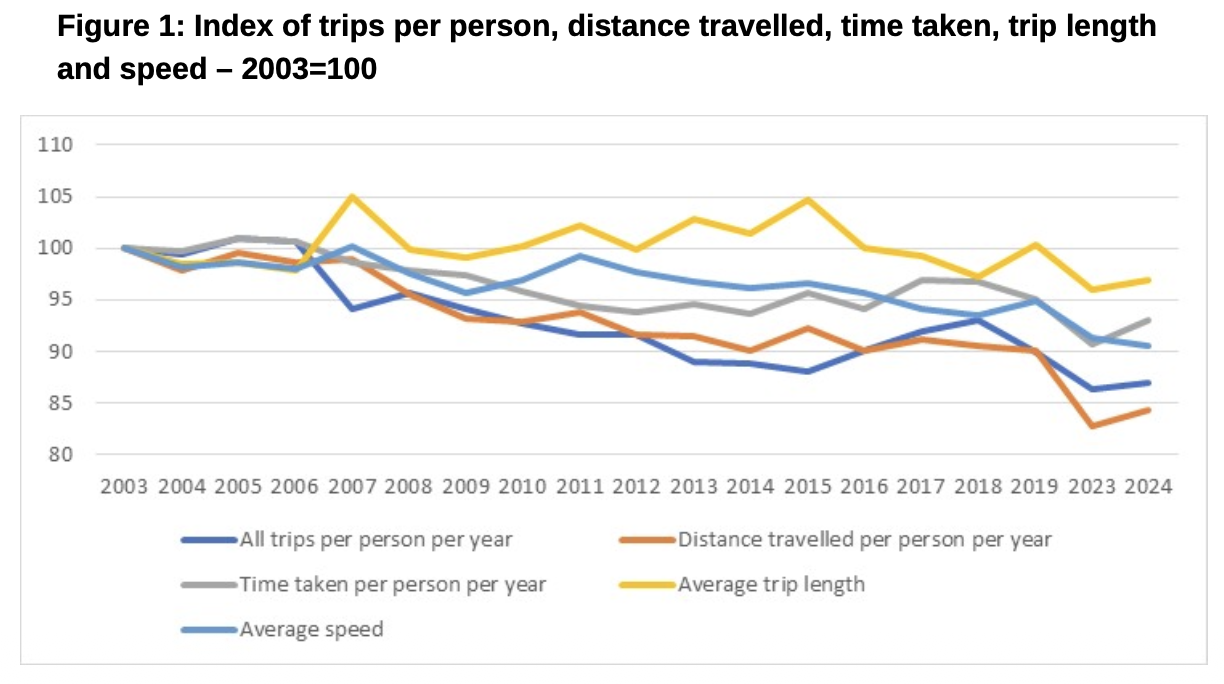
Let’s start with some basics. In 2024 we each made on average 920 trips, travelled 6,100 miles and spent 360 hours traveling. Apart from during the pandemic those numbers have broadly stayed the same over the last 20 years.
Figure 1 shows these key metrics, trips, distance, time, average trip length and average speed as an index with 2003=100. The number of trips we make each year has slowly reduced over time along with the average distance we travel, meaning that average speeds of those journeys have fallen. In part this is due to a move to slower modes ie away from car driving. However, all these metrics have only moved in a fairly narrow band and that heuristic of spending an hour a day traveling still broadly holds true.
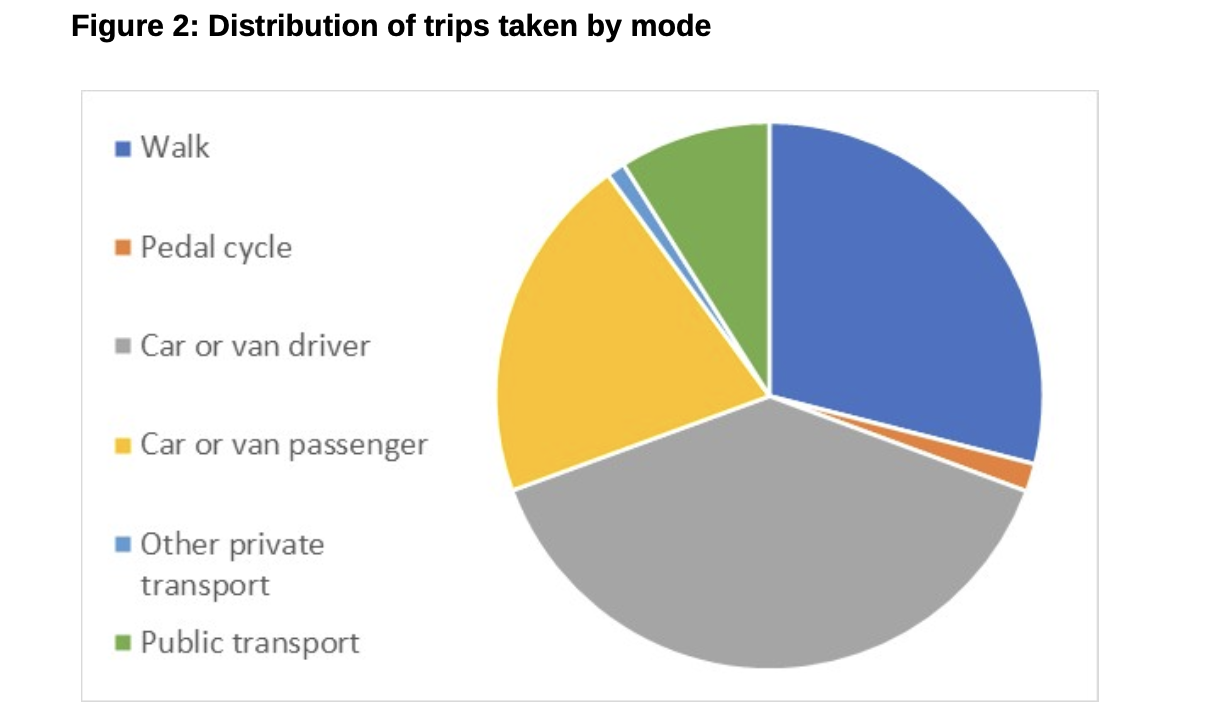
Of those 920 trips we make, the breakdown by mode is shown in figure 2. Sixty percent of trips are made as either a driver or passenger in a car/van, 29% are walked and public transport (bus, rail, taxis etc) accounts for just 9%.
When it comes to distance travelled then the distribution by mode is shown in figure 3. Driving now accounts for over three quarters of all miles travelled and public transport 17%.

Most of the trips we take are very short, 25% are less than a mile and less than 2% are more than 50 miles long, figure 4.

In theory some two-thirds of trips we make are short enough to be done by walking or cycling. Figure 5 shows the modes we use by distance. Not surprisingly the vast majority of trips under 1 mile are walked and as many trips between 1-2 miles are walked as are driven. It is England’s very low use of cycling for such trips, and those slightly longer, which is the issue rather than a reluctance to walk.
Rail starts to a reasonable market share for trips over 25 miles. It is notable that for trips over 100 miles you are almost equally likely to be a car passenger as a driver, reflecting that a high proportion of these trips are shared for leisure purposes.

Over 80% of us use a private car at least once a week, while nearly a quarter use a local bus at the same frequency, figure 5. However, over a year, more of us will have travelled by train than by bus. Nearly half the population never use a local bus, the same proportion as those who don’t use a taxi/minicab, while 70% of us never cycle.

The reasons why we travel has changed over the last 20 years, figure 7. Home and hybrid working has reduced the need for commuting, and video conferencing has made major inroads into business trips.
Shopping has meanwhile partially moved online, and even visiting friends has seemingly become less popular.
Education is one activity that still takes place in person, so generates a similar number of trips, while we are doing more leisure trips and more frequently just going out for a walk. That means ‘travel’ that is not primarily linked to getting to a destination to fulfil a purpose there, or susceptible to being switched to another mode of ‘transport.’

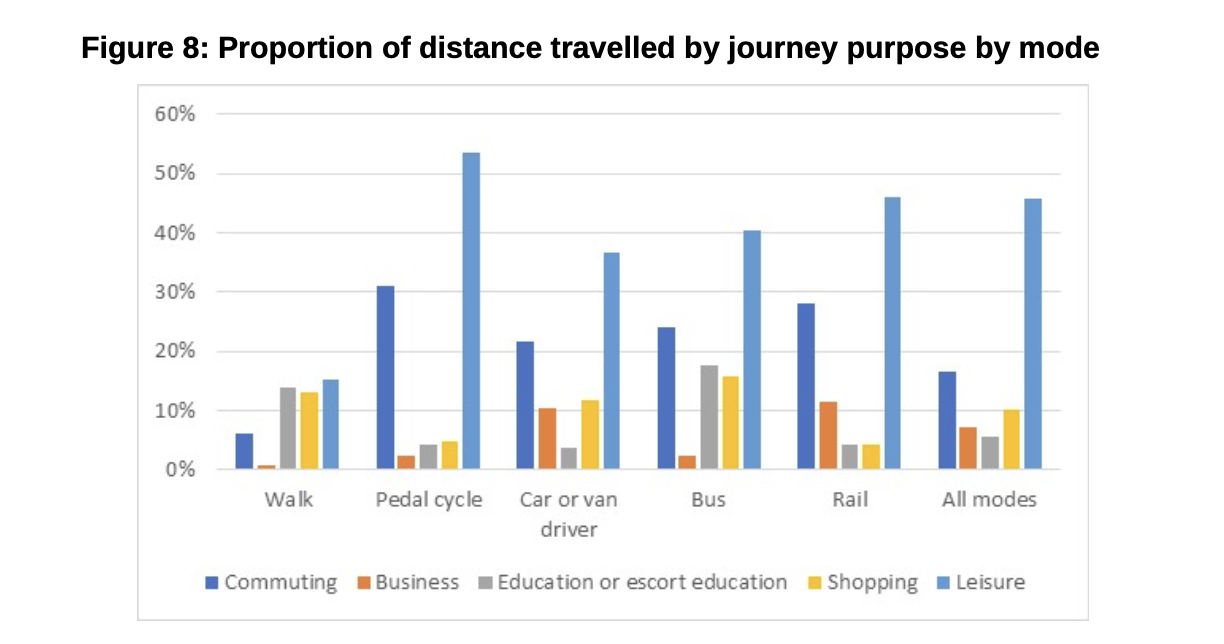
Figure 8 looks at the distance we travel by each mode broken down by journey purpose. Walking trips are fairly split between education/escort education, shopping and leisure. Cycling is dominated by leisure and commuting. Bus is more proportionately used for shopping and education than other modes, and rail for business and commuting.
That fall in commuting trips means that a smaller proportion of trips being started at any one time are for this purpose.
Figure 9 shows what proportion of trips starting within each hour are for commuting, averaged over the periods 2002-2006 and 2023-24.
Back in 2002-2006 the majority of early morning trips were for commuting – over 50% in each hour between 03:00-08:00, when school trips started to kick in a major way. In the evening peak, commuting made up 35% of trips starting between 17:00-17:59.
By 2023-24 the pattern had changed significantly. Commuting now makes up a larger proportion of very early morning trips, but between 07:00-07:59 trips to work make up less than 40% compared to 58% back in 2002-06. In the evening peak, they now make up 10 percentage points less.

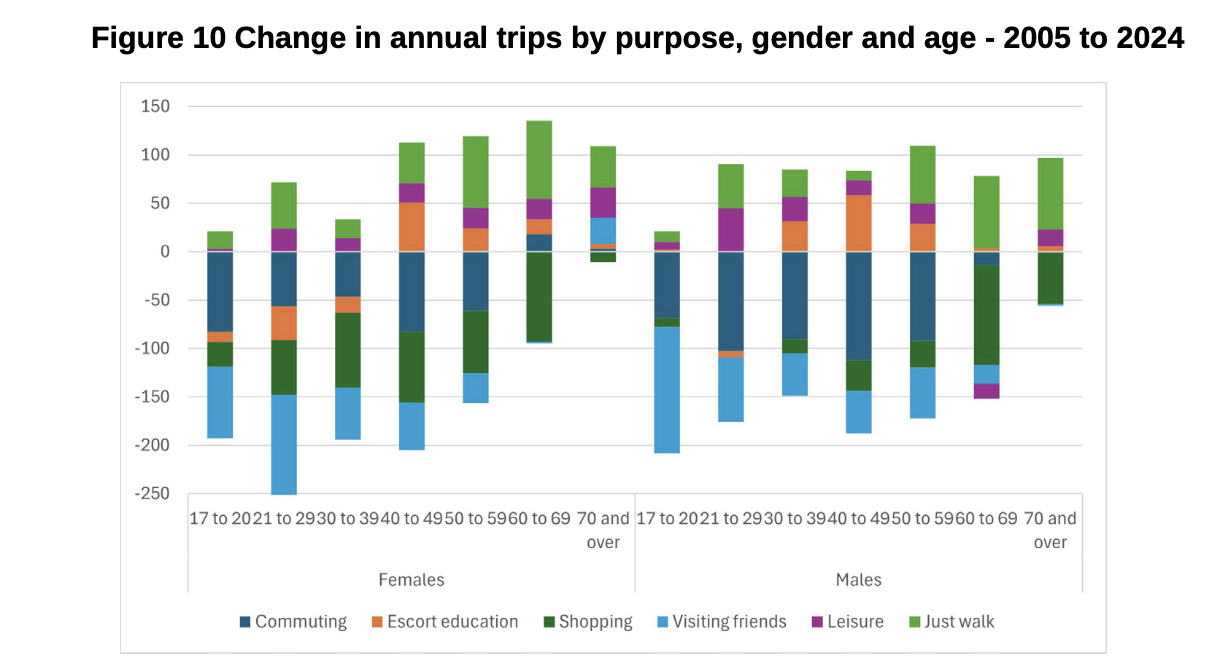
Figure 10 illustrates the change in the number of trips we make by age, gender and journey purpose between 2005 and 2024. This twenty-year period that has seen changing social norms and technological transformation, which can be deduced from the data.
The most striking point is that, with the exception of those aged over 70, we are making fewer trips overall. Yet within this decline, there are nuanced shifts.
Walking trips have increased across all age groups, particularly among older adults, perhaps reflecting health consciousness or maybe because it’s the only reason to leave the house now. Leisure travel has also risen, suggesting that more people have discretionary time, or are prioritising the use of it differently.
Education ‘escort trips’ illustrate changing family dynamics. More men are now doing ‘the school run’, doubtless a result of hybrid working and evolving expectations around gender roles. For women, these trips are occurring later in life, influenced by older parenthood and the growing role of grandparents in childcare, the latter driven by the rise in working mothers.
Commuting trips have dropped significantly, a clear consequence of hybrid and remote working. However, women in their sixties buck this trend, reflecting the impact of the raised state pension age. Shopping trips have also declined, especially among women, due to increased participation in the workforce, and the shift to online retail. Maybe surprisingly, the largest absolute drop in shopping trips is among the over-60s, for both men and women.
Perhaps the most concerning trend is the steep decline in trips to visit friends, particularly among younger adults. This raises questions: are we becoming less sociable, or are we simply socialising and ‘meeting up’ differently, through shared leisure activities or going online?
Travel is a derived demand and as our lifestyles change, so do our travel patterns.
The National Travel Survey paints a picture of a nation whose travel activity is stable in volume, but our habits are shifting in purpose. We’re still spending about an hour a day on the move, but what we do with that time reflects a society in transition: less commuting, more leisure, fewer shopping trips, and a subtle redefinition of how we make social connection.
The car remains dominant, but walking is quietly rising. So while the numbers may look familiar, the lives behind them are changing.
Anyone in transport planning – or in service operations – should look hard at these evolving patterns as they are setting a new agenda for how we need to cater for future accessibility and mobility needs.
All data is sourced from the English National Travel Survey - https://www.gov.uk/government/statistics/national-travel-survey-2024
The National Travel Survey 2024 sample included 7,530 households in England that completed both an interview and a 7-day travel diary. An additional 1,312 households provided interview data but did not complete a diary, which is included for household-level analysis but not for trip-level analysis. The overall issued survey sample was 31,680 addresses. It is based on a stratified 2-stage random probability sample of private households.
Information was collected on the key characteristics of each participating household and any vehicle to which they have access . Data is recorded at a number of different levels (household, individual, vehicle, long distance journey, day, trip and stage).
John Siraut is an independent economics and data analyst.
This article was first published in LTT magazine, LTT925, 30 October 2025.
You are currently viewing this page as TAPAS Taster user.
To read and make comments on this article you need to register for free as TAPAS Select user and log in.
Log in