TAPAS.network | 19 September 2023 | Commentary | John Siraut
NTS 2022 records continuing impacts of the Pandemic – but dominance of car still shows through

Travel patterns were dramatically changed by the COVID 19 Pandemic, and the restrictions it brought. The new National Travel Survey results for 2020 show a further revival against the very low trip levels of 2020 and 2021, but still below 2019. examines the data, and considers whether it indicates a permanent new position, in which travel activity is lower, and car users and non users have very contrasting types of trip making.
THE LATEST National Travel Survey (NTS), covering activity in 2022, has just been published, with 111 tables describing almost every aspect of travel in England. One article can therefore cover only a small segment of that wealth of data, so here I look particularly at how travel patterns have changed post-COVID-19, and how car ownership- or lack of car ownership - impacts more generally on how people travel.
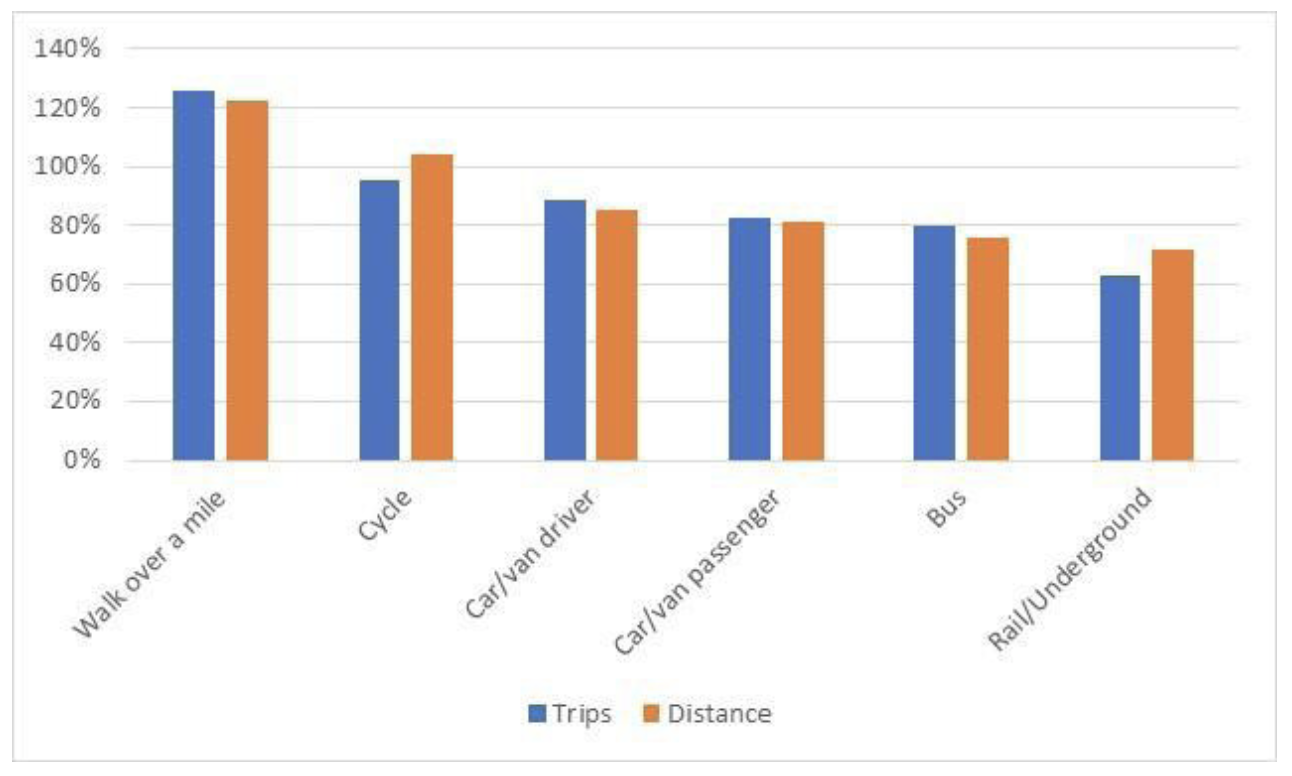
In aggregate in 2022, 10% fewer trips were made and 17% fewer miles travelled than in the pre-pandemic world of 2019. As Figure 1 shows, this reduction applies to virtually all modes of transport with the clear exception of walking. In 2022, 26% of all trips were by walking compared to 2019, reversing a long-term trend of a decline in walking. The boom in cycling seen during the pandemic had fallen away, however, and the number of trips made by bike was broadly at the same level as 2019 , although people were now on average cycling further than they did previously. Car use was down by 11%, while bus use had fallen by 20% , and rail/underground by 37%, compared to pre-pandemic However, the rail modes were seeing longer journeys, with short commutes being replaced by fewer but longer leisure trips.
Figure 1: Number of trips and distance travelled by mode in 2022 compared to 2019
Commuting and shopping trips constituted a third of all trips in 2022. The latest NTS now provides data by day of the week, and Figure 2 shows how commuting and shopping trips have changed by day of week compared to pre-COVID-19. It highlights that commuting on Monday and Friday has fallen most, down around 20% compared to pre-COVID-19 as office workers continued to work from home. What is perhaps more surprising is that shopping trips have fallen most on Mondays and Saturdays, both down by over 20%, highlighting the impact of the move to on-line shopping. Trips for other purposes, while down compared to pre-COVID-19, have not fallen as much as for the main two journey purposes.
Figure 2: Proportion of trips by day of week and purpose in 2022 compared to 2015-19
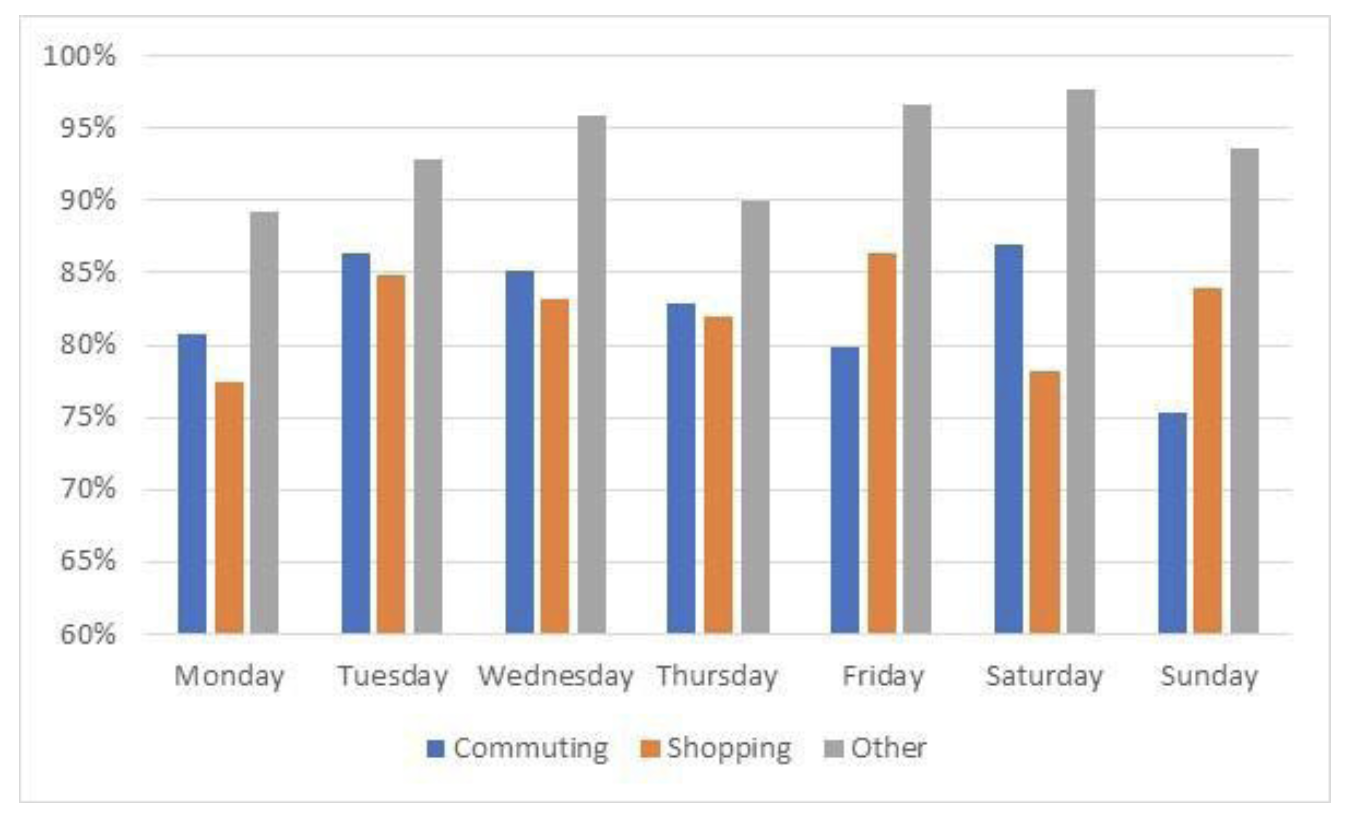
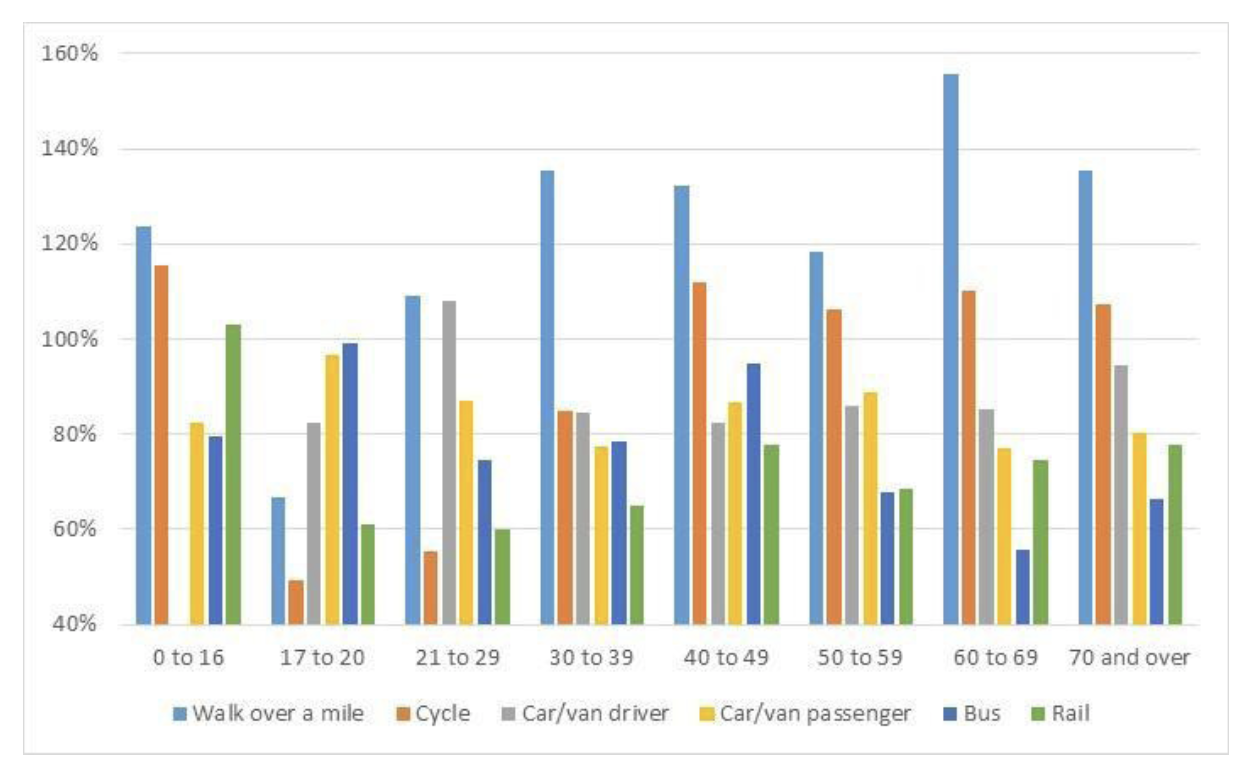
Figure 3 considers how travel patterns have changed by age. Apart from 17-20-year-olds, all age groups have seen a marked increase in walking, up nearly 60% for 60-69-year-olds compared to 2019. Cycling is more of a mixed picture with a large fall for age groups between 17 and 39, but increases in most other age groups. The 21-29-year age group has increased car use since 2019, but other age groups have generally seen a 20% reduction. Bus use has returned to 2019 levels for 17-20-year-olds but is markedly down for the over 50s. Rail use is another mixed picture, with virtually no change for 0-16-year-olds, presumably linked to travel to school, but markedly down for all other age groups. However, for those aged over 60 rail has performed better than the bus network.
Figure 3 Proportion of trips by age and mode in 2022 compared with 2019
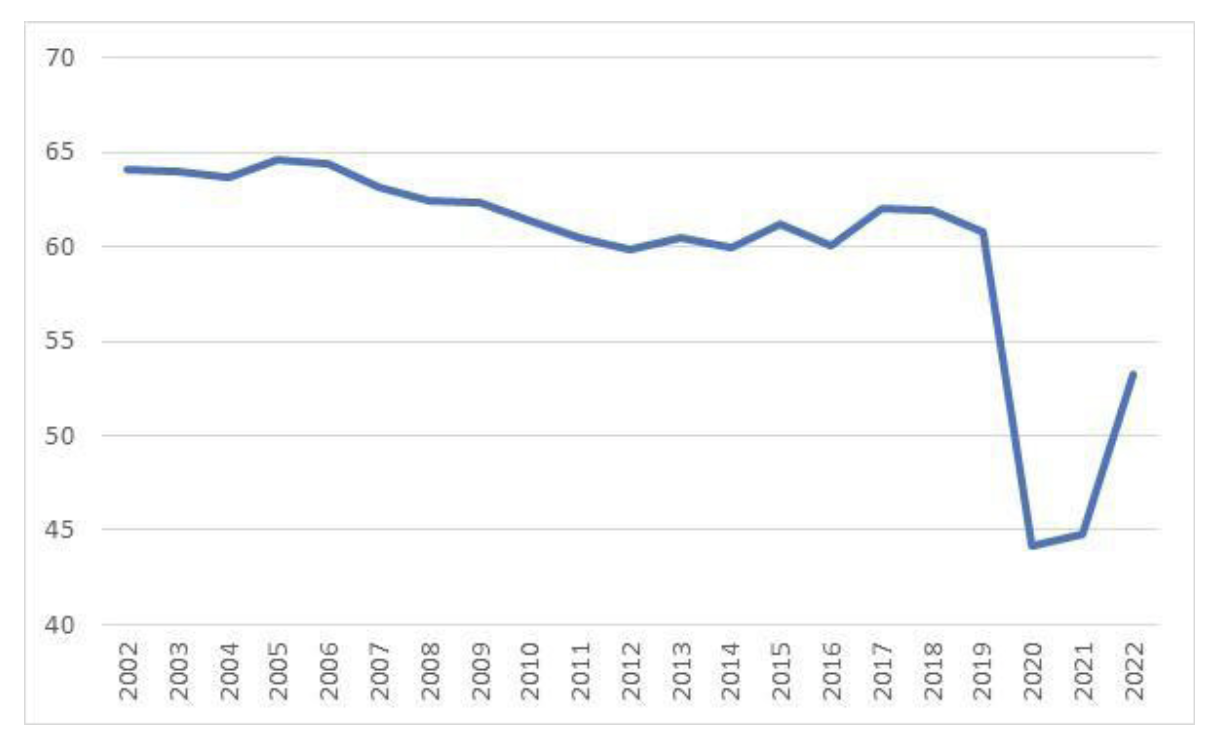
A common and consistent finding across the world for many years is that people spend on average around an hour a day travelling. COVID-19 significantly reduced that time as can be seen in Figure 4, down to 44 minutes in 2020 and 2021. While 2022 saw that increase to 53 minutes, it is still well below pre-COVID-19 levels. The question is, have we permanently reduced the time we are prepared to travel , or will it drift back up to nearer that worldwide average of 60 minutes a day?
Figure 4: Minutes a day spent travelling 2002-2022
What has changed over time is the distance that people can travel in that hour. As technologies developed and we moved from walking to cycling to cars, and from hose drawn stagecoaches to trains and aircraft, the time we spent travelling remained broadly constant, but the distances we were travelling increased. However, over the last 20 years or so the total distance we have been travelling has declined steadily, which appears to be reflected in reducing average speeds.
Figure 5 shows average speed for car/van drivers, rail users and across all modes over the last twenty years. Average car speeds have fallen by around 2mph; rail has been more erratic, but on average has slightly trended downwards; and average speed across all modes has also fallen by 2mph, although slightly up last year from the situation during COVID-19. A 2mph reduction may not seem much, but over a year equates to a reduction of over 700 miles travelled for an average daily one hour travelling time.
Figure 5: Average speed by mode 2002-2022

The impact of car ownership on the average speed people travel at, and hence the distance they can travel, is clearly shown in Figure 6. The average annual distance a person travels in a household with no car or van is about half of that of someone living in a household with a car/van. This is due to the fact that the average speed they can achieve is also around half of that of a person in a car owning household, hence the distance they can travel is roughly half.
Figure 6: Average speed mph (LHS) and annual miles travelled (RHS) by car ownership 2022

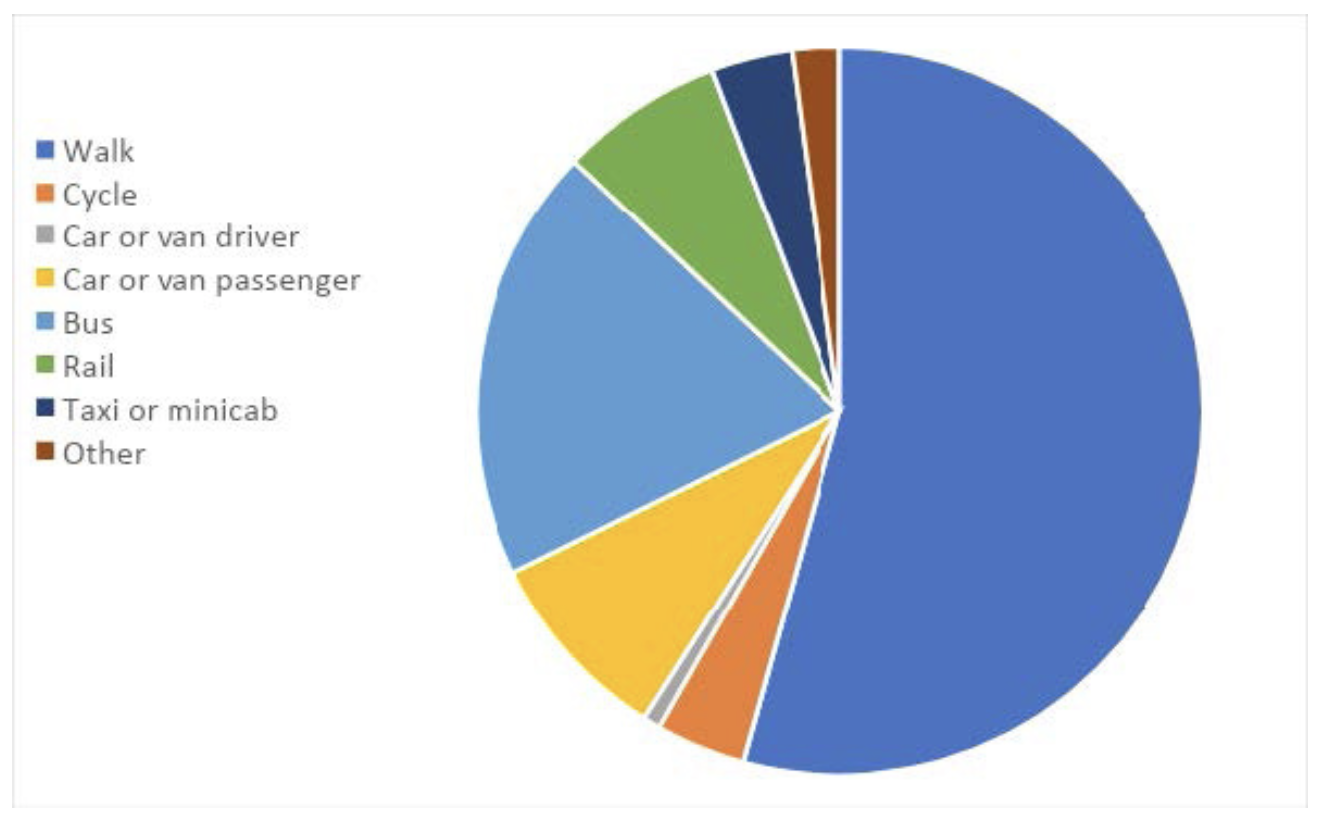
The differences between the experience of car and non-car users is even more stark in Figures 7 and 8. Nearly three quarters of all trips made by those with a car is in a car, either as a driver or passenger, while almost a quarter are walked, leaving just 3% by public transport. The picture is very different for those without a car. For these, most trips are made by walking, and over a quarter by public transport.
Figure 7: Distribution of trips by mode made by main car driver in a household with car/van 2022

Figure 8: Distribution of trips by mode made by person in a household with no car/van 2022
Looking at the situation overall, it seems like we may be moving to a less transport intensive way of life for individuals. There are clear factors potentially driving this: Increased working from home, home delivery of shopping and takeaway meals, the growth of home entertainment and streaming services , and interactive digital meetings for both business and pleasure. All have reduced the need for personal travel , although increasing demand for deliveries as things are brought to us rather than purchased on visits to shops and restaurants.
It could meanwhile be said we have become two separate communities: the car owners and the non car owners. Those in the car owning community are heavily dependent on a car for the majority of their trips, travel further, and rarely use public transport. The non-car owning community travel far less, and hence remain more local to their neighbourhood because most of their trips are walked, and they are not surprisingly are far more dependent on whatever public transport is available for the trips they do make.
Source
National Travel Survey 2022
About the National Travel Survey data and reports
National Travel Survey data collection consists of a face-to-face interview and a 7 day self-completed written travel diary, allowing household travel patterns to be linked with individual characteristics. The survey covers travel by people in all age groups, including children. Approximately 16,000 individuals in 7,000 households in England, participate in the survey each year.
NTS is designed to monitor long-term trends in personal travel and to inform the development of policy. It is the primary source of data on personal travel patterns by residents of England within Great Britain.
The survey collects information on how, why, when and where people travel as well as factors affecting travel (for example, car availability and driving licence holding).
A range of new ad-hoc pieces of analysis have also been published which can be found on Ad-hoc National Travel Survey analysis.
John Siraut is director of economics at Jacobs.
This article was first published in LTTmagazine, LTT876, 19 September 2023.
You are currently viewing this page as TAPAS Taster user.
To read and make comments on this article you need to register for free as TAPAS Select user and log in.

Log in
Read more articles by John Siraut
Read more articles on TAPAS
