TAPAS.network | 9 January 2024 | Commentary | John Siraut
Transport Statistics Great Britain (TSGB) 2023

The publication of the annual compendium of Britain’s transport statistics has traditionally been an important data source for the profession, though less significant in recent years with other material emerging more regularly. dips into the newly published Transport Statistics Great Britain (TSGB) 2023.
DECEMBER SAW the publication of the latest edition of Transport Statistics Great Britain (TSGB) 2023. While it usefully provides various cross modal comparisons and reasonable runs of historic data to enable trends to be analysed, changing statistical definitions and missing data makes comparisons between years more complex. For example, key environmental data for 2022 is not yet available. There are also, of course, the interruptions to ‘normal’ patterns by the Covid pandemic to take into account.
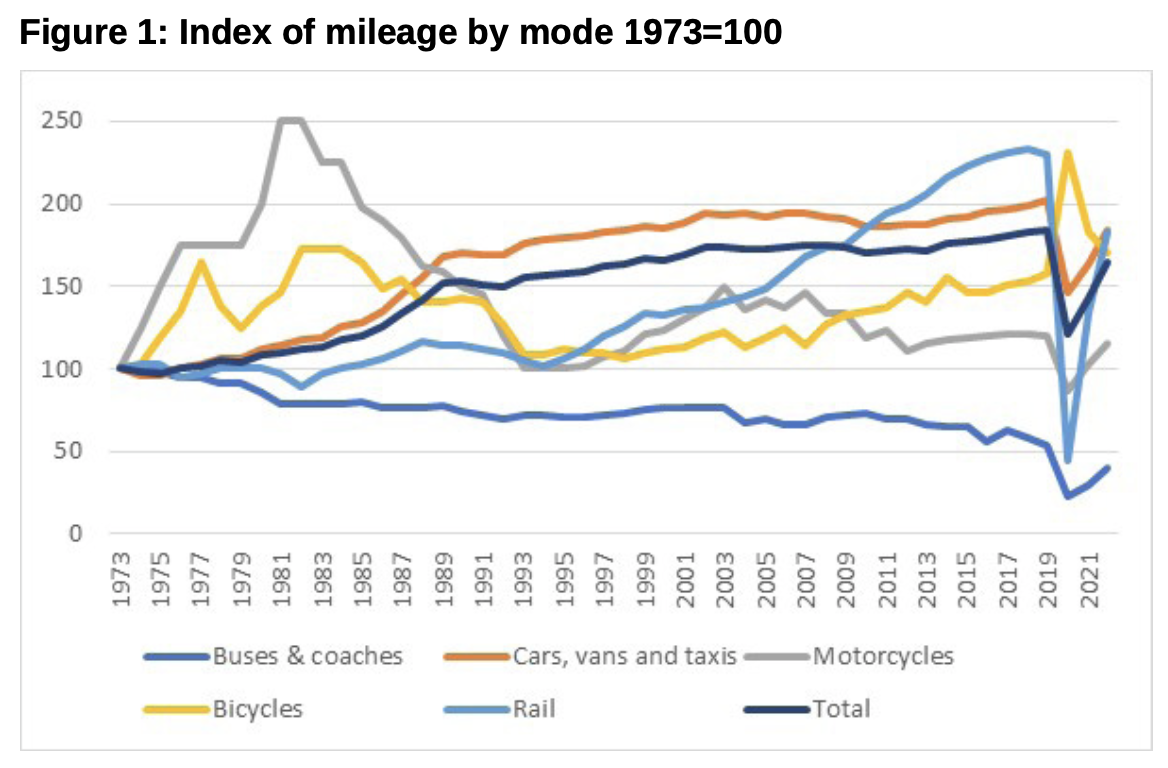
One long-standing historic table of considerable continuing interest remains and that is distance travelled by mode. Figure 1 shows trends across all the main modes of transport over the last 50 years in index form taking 1973 as the starting point.
As shown, car use grew steadily in the 1970s and 1980s, but then stagnated. Between 1980 and 1989 car mileage grew by 50%, but between 1990 and 1999 it grew by 9%, just 3% between 2000 and 2009 and 8% from 2010 to 2019. Following the pandemic, in 2022 car mileage was less than it was in 1999. Having been stagnant for broadly the first 20 years until 1993, rail use then rapidly grew for the next 30 years, with by the far highest growth rate of all transport modes, through to when the pandemic hit. It is hard to square the present pessimism about the future of the rail sector in some quarters with the fact that demand in 2022 was 80% higher than 50 years ago, and on a par with the growth in car use over the same period despite the impact of the pandemic.
Bus and coaches have, in contrast, for long been the poor relation of public transport with usage falling virtually uninterrupted for 50 years. A recent nascent uplift post-dates these figures.
Motorcycle and bicycle use have had differing fortunes. Both saw increasing use in the 1970s and early 1980s. Motorbike use then collapsed during the 1980s although it never fell below the level in 1972. There was then a steady recovery in use in the 1990s, up by around 50% before declining again and then stagnating for the last decade. Bicycle use on the other hand, having risen by around 70% by the mid-1980s, then declined back to its early 1970s level by the late 1990s. It has then seen a steady increase in use, peaking during the pandemic. Although usage has slipped back again, mileage in 2022 was considerably higher than pre-pandemic and up 50% since the start of the new century.
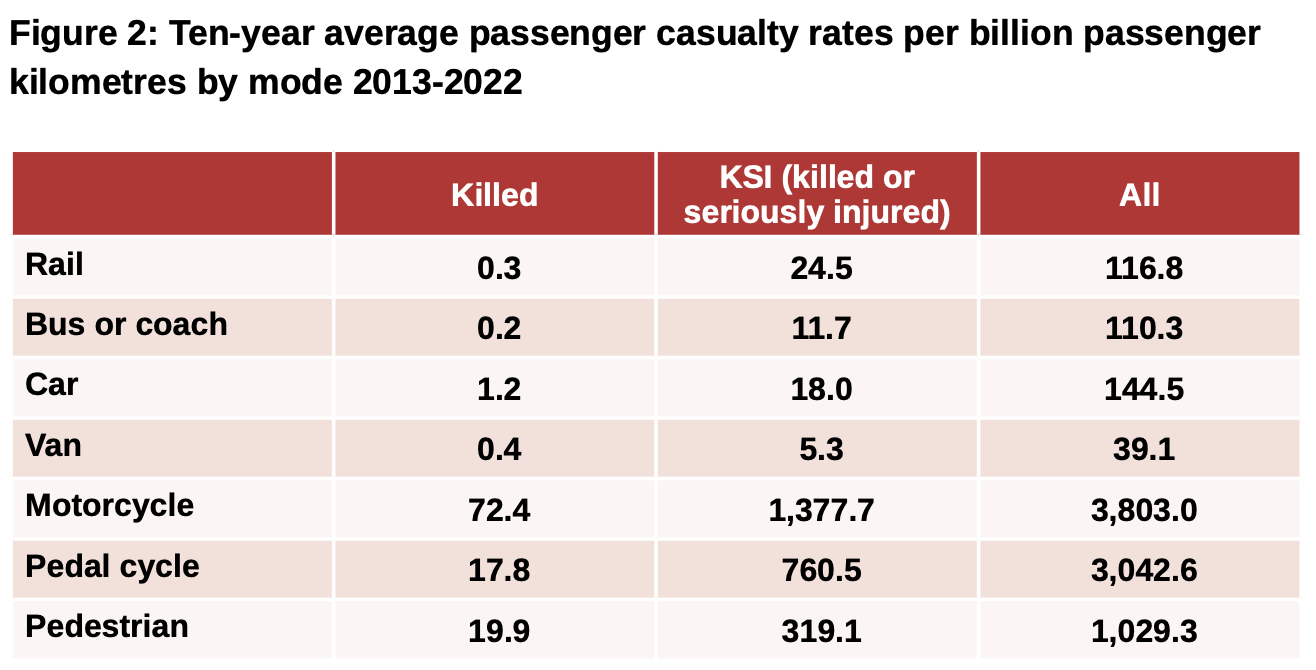
The TSGB now offers more cross-modal comparisons than previously. One such comparison, where the results have changed in recent years, relates to casualty rates. Figure 2 compares the ten-year average casualty rates per billion passenger kilometres travelled by mode. While rail and bus/coach maintain their position as having the lowest casualty rate for fatalities across all modes, there has been a significant improvement in the safety rate of cars and vans, reducing the number of seriously injured since the early 2000s as vehicles have become far more crash worthy. The same improvements are less evident with public transport. The highest casualty rates actually relate to the most sustainable modes (walking and cycling), and for motorcycles. However, it should be noted that average trip lengths for walking and cycling are far shorter than for car trips, so the accident rate per trip between these modes is not so great.
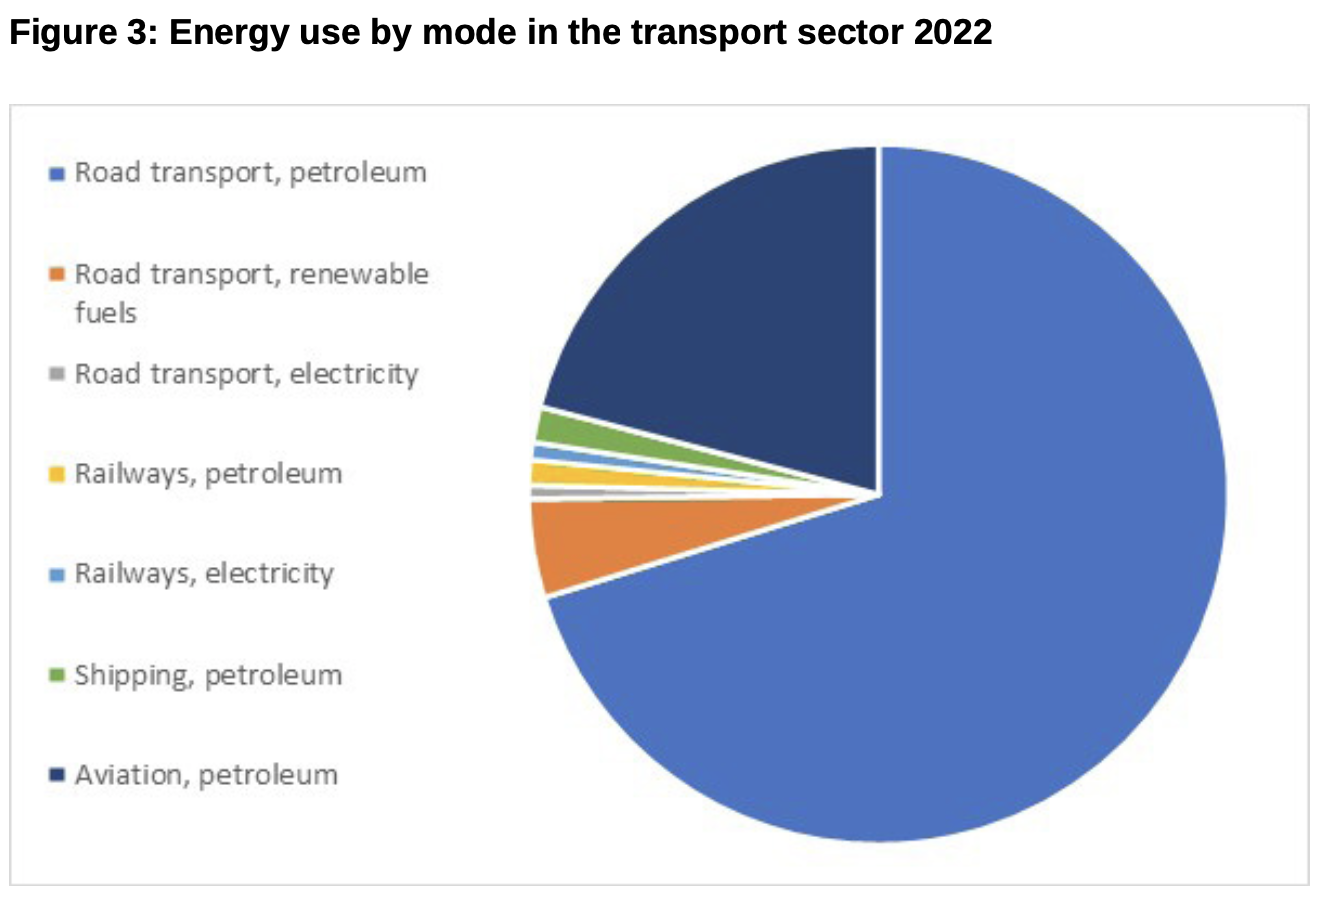
In the absence of the aforementioned updated environmental emissions data, figure 3 highlights energy consumption by mode. The transport sector consumed the equivalent of 50 million tonnes of petroleum in 2022, broadly the same as pre-pandemic. Over 70% of transport energy use is petroleum for road transport, followed by 21% for aviation. Renewables are slowly making headway in road transport, now accounting for over 5%. The extent of the decarbonisation task in the rail sector is highlighted by the fact that petroleum still accounts for 60% of energy use.
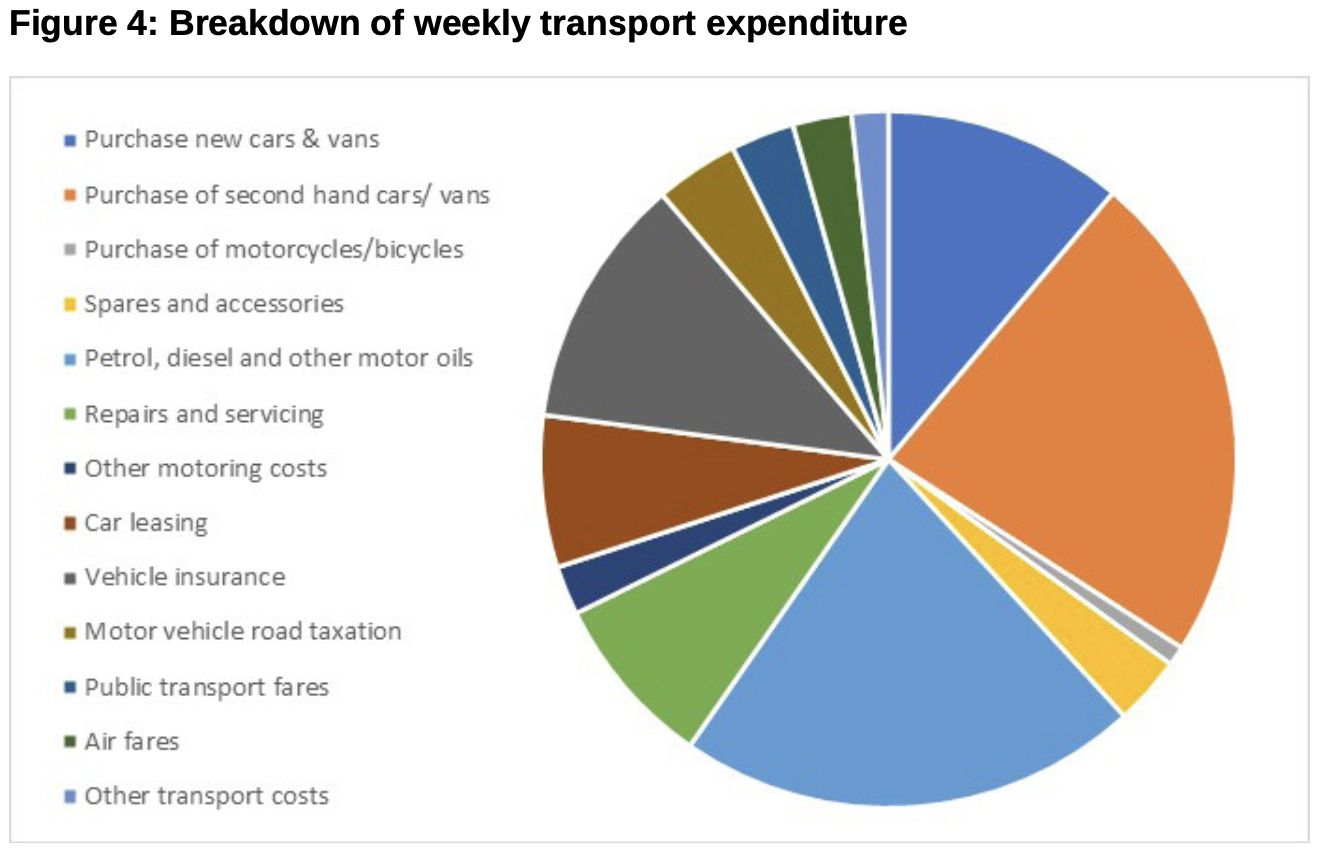
As well as distances travelled, and energy consumed, the other key data area s money spent. In 2022, the average household spent £88.10 a week on transport-related expenditure, the equivalent of 14% of total weekly spending. As can be seen in figure 4, the largest items of expenditure were for the purchase of second-hand vehicles, fuel, and vehicle insurance. Public transport fares accounted for just 3% of expenditure, only slightly higher than the 2.7% spent on air travel. It is notable that while car kilometres were just over seven times higher than public transport mileage, weekly household expenditure on car travel was over 30 times higher than that for public transport. This suggests that the average cost of car travel is significantly higher than the average cost of public transport.
It is perhaps worth noting, going forward, that it will become increasingly difficult to accurately determine transport expenditure, as households charge their vehicles from their domestic electricity supply rather than filling up at a petrol station, where consumption can be directly monitored.
Whilst TSGB certainly remains a useful compendium of transport statistics, it is probably not now any longer the “go to” source for all transport-related insight as it was in the past.
Reference:
All data is sourced for TSGB 2023 https://www.gov.uk/government/statistics/transport-statistics-great-britain-2023
John Siraut is director of economics at Jacobs.
This article was first published in LTT magazine, LTT883, 9 January 2024.
You are currently viewing this page as TAPAS Taster user.
To read and make comments on this article you need to register for free as TAPAS Select user and log in.
Log in