TAPAS.network | 6 March 2024 | Commentary | John Sutton
The Theoretical and Practical Limits to Demand Responsive Transport Services

As someone involved in studying and delivering community transport and dial-a-ride schemes from the 1980s, and more recently a consultant to one of the Rural Mobility Fund DRT projects, believes he can offer some perspective and realism to the true prospects for DRT in the passenger transport spectrum. In this contribution he explores the theoretical and practical limits of DRT, and why these realities mean it can only be effective in limited niche markets and special circumstances, even with the deployment of the latest scheduling and communications technology.
Introduction
Recent trials of demand responsive transport (DRT) services across the United Kingdom have demonstrated the limits of this type of passenger transport service even when deployed with the latest information and communications technologies - sometimes referred to as Digital or Dynamic DRT (DDRT). Low passenger numbers and poor financial performance do not however seem to have deterred proponents of the concept in continuing to advocate DRT as a solution to passenger transport in both urban and, particularly, rural/low demand areas. Even with the application of the latest technologies, most of the trials have failed, with the services often withdrawn as extremely expensive calls on public funds in terms of cost per passenger, often before the demonstration period ends. Why is this, and what lessons can be learned about where this kind of service might be a genuinely worthwhile part of local passenger transport provision. This article examines the reasons why DRT has failed to live up to the expectations (hype?) of those promoting this mode of transport, and offers some insights into the fundamentals of DRT scheduling that limit its practical implementation, at least in terms of a viable commercial business model, or producing an advantage over either conventional bus services, or traditional taxi/private hire services[1]. It then outlines situations where DRT may nonetheless be worthwhile deploying to meet the needs of niche transportation markets or as a catalyst to generate new demand for other forms of public transport.
The DRT vision – and its limitations
The concept of DRT (or Dial-a-Ride as it was initially known) originated in the USA in the 1960s and was first operationalised in Mansfield, Ohio in 1969. Most of the early DRT systems were sponsored by government agencies (local and federal) with implementation by contracted commercial operators as well as publicly owned transit companies, provided with public funding support. They also involved university research departments such as the Massachusetts Institute of Technology, which reviewed the operational parameters for flexible scheduling of DRT vehicles (more on this in the next section).
The Dial-a-Ride concept transferred over to the UK in the early 1970s. The first Government-backed experiment began in Abingdon in 1972, and by 1976 eleven pilot projects were in progress, some sponsored by Transit minibus manufacturer Ford, and mainly operated by the publicly-owned National Bus Company in areas including Harlow new town and Harrogate. These experiments were established on similar lines to those operating in the USA and were conceived as public D-a-R services complementing, and in some cases supporting, existing bus services. What captured the politicians and planners imagination was the idea of providing a transport system free of the constraints of operating large buses on fixed routes at specific frequencies and going ‘where users want to go’. Dial-a-Ride represented a radical departure from the conventional approach to bus service planning, which promised to open new opportunities in how public transport was delivered (Sutton, 1987).
The original objectives of D-a-R differed from conventional public transport planning in two major aspects:
-
To cater for widely dispersed trip patterns (many-to-many); and
-
To provide a service in suburban and fringe low-density areas to mainly non-work journeys (including feeders onto conventional bus and rail services).
The D-a-R services were mostly confined to one section of the city, a small town or suburb, or rural area around a market town, and later second phase systems were most often restricted to serving those with limited mobility, such as the elderly and disabled users. This ‘sectorisation’ of D-a-R services and their intended users is a common feature of systems in the USA and UK, and in the latter case was characteristic of the second phase schemes which offer a combination of many-to-many and many-to-few destinations.
In the UK, all eleven of the first phase D-a-R services were abandoned after their trial periods and judged to have been failures. Their lack of success was attributed to their poor performance in attracting new passengers (amounting to only 8-12% of extra journeys), their inability to handle many-to-many dispersed journey patterns with journey times not much better than conventional bus services, and their high cost compared to fixed scheduled bus services, with most not even covering their operating costs (Oxley, 1977). Fortunately, they were extensively monitored as ‘experiments’ by Government, so the outcomes were clear for all to see (unlike many in the current wave, though also publicly funded).
A review of these first phase D-a-R schemes by the Transport Road Research Laboratory concluded that they could only handle 100 trips per hour using a maximum of 20 vehicles and that many-to-one systems are likely to be more successful (Mitchell and Slevin, 1974). This trip rate of less than 5 passengers per hour per vehicle on many-to-many systems has proved to be remarkably consistent over time, notwithstanding the application of computerised scheduling which became more prevalent from the 1980s. Even with the most recent advances in technology the latest DDRT systems struggle to provide much better performance in terms of either operational efficiency or appeal to passengers and hence usage.
The demise of the early D-a-R schemes, at least those intended as public transport services, led to a re-appraisal of the operating model on two crucial elements. Firstly, the ability to provide a door-to-door service was latched upon by the fledgling community transport movement in the UK, akin to US ‘Paratransit’ practice, who began to trial D-a-R as a specialised form of transport for people with disabilities who found conventional buses inaccessible, which in turn provided an impetus to the development of accessible minibuses and buses. Secondly, while many of these schemes provided many-to-many journeys, they also adopted many-to-few journey patterns serving central places like shopping centres, social and health facilities and thereby improved their performance, both in terms of journeys offered and user take up. Government policy has supported the role out of these schemes, and most are now delivered by a mix of dedicated Community Transport operators, social services departments or local transport authorities, as well as services provided under contract by private bus and taxi companies. Since the 1980’s extensive Dial a Ride networks were built up in the larger cities, such as the ‘Ring’n’Ride’ schemes in the West Midlands and Greater Manchester and London DAR. Services are pre-booked well in advance with passengers willing to accept a limited level of flexibility in departure times in return for a ‘lifeline’ door-to-door service.
The transition from voluntary run D-a-R in the 1980s and 90s to professionally organised schemes in the 2000s and beyond has demonstrated a niche market for the DRT model despite the high costs. Their justification was also helped by the government decision to implement the English National Concessionary Travel Scheme for elderly retired and disabled people from 2008, which now costs around £1 billion per annum, and is an important source of revenue for the bus industry[2].
Indeed, concessionary passes are accepted on many D-a-R systems, such as the fflecsi DRT services operating in several areas of Wales. Integrating DRT for both specialised social support services and public transport to achieve greater cost effectiveness has proven to be a successful model in some areas, such as the Lincolnshire Call Connect service where DRT serving remote communities feeds into fixed route services and carries school children who otherwise would require a dedicated vehicle, thereby saving money. Some of the fflecsi DRT in Wales provide a similar function for work and education journeys.
As mentioned, In the USA, the equivalent of the specialised D-a-R for those with mobility impairments is referred to as paratransit and delivers a mixture of DRT and subscription services funded by local transport authorities and federal grants. These were mandated through a variety of ‘welfare’ and local community support programmes enacted by federal legislation between 1970 and 1978. The situation in the USA is complicated by the absence of conventional transit in many communities so paratransit may be provided by a Human Services agency or a local community transport group. As in the UK, several other European countries also began experimenting with DRT in the 1970s and 1980s and produced some innovative schemes which were among the pioneers of computerised and dynamic scheduling including the Telebus service in Berlin, Retax in Wunstorf (a suburb of Hanover), Rufbus in Friedrichshafen/Lake Constance County in Southern Germany, and Bustaxi in Delph, Netherlands. Some of these are still in operation, albeit they have morphed into the integrated multi-purpose DRT mentioned earlier and use the latest technology to deliver their services. However, like the schemes in the UK and USA, they are not commercially viable and need financial support.
DRT in the Uber age
Between the mid-1990s and mid-2010s there was little in the way of further development in the nature of DRT services. They continued to be deployed as specialised transport or in specific areas, but there were no real advances in the operating model, or enthusiasm for deploying DRT in public transport. Though bus companies had embraced fixed route minibus services for some residential areas following deregulation in 1985, they were little enamoured of DRT services, and Local Transport Authorities could not generally afford to underwrite them.
There seemed to be a perceived change in thinking about DRT in the 2010s, with the creative disruption brought about by a new breed of what are referred to as Transportation Network Companies (TNC), providing taxi/private hire services to a new business model epitomised by Uber and Lyft. These companies applied advances in communications and location tracking technology alongside a supply system that connects users with the cars provided by individual self-employed owner/drivers to match passenger demands collected by the TNC intermediaries to available vehicles. The business model relies on apps for the passenger and driver with transactions brokered by the TNC, who take a commission on each fare, hence the positioning of the TNC as an asset-light intermediary, rather than a traditional transport operator. This proposition has been challenged in lawsuits questioning the relationship with the intermediary and the vehicles and their drivers they use in several countries, and in the UK Uber has agreed to abide by taxi safety regulations with drivers entitled to minimum pay and holiday pay.
Despite the lack of stability and unproven viability of these new taxi/private hire service providers they appear to have been seen as having some ‘magic quality’ that could extend to a version of public transport for the digital age - and in particular DRT.
The latest Uber/Lyft style technology has since been adapted for the new generation of DRT services - referred to as DDRT. Until the development of cloud technologies and web-based apps, DRT services were first manually administered from central dispatch centres, and then using specialised booking and scheduling software installed on a local server network. Vehicle tracking, if deployed, was through other specialist systems. Communication with users was via phone and email. These systems were expensive to implement and required specialist staff and training to manage and operate. This served as a substantial barrier to both public and private operators, who had limited choices among the small number of technology companies offering the specialist software.
It should be noted that neither Uber or Lyft are profit-making companies in conventional terms, forming part of the wave of digital revolution disruptive new businesses seeking to build scale and stockmarket asset values as a priority. In this mission they have concentrated on driving volume and turnover. They have picked and chosen where to operate on that basis, not often offering a service in low demand suburban and rural areas, and rarely in the kind of territory where DRT schemes have been introduced. In addition, they have worked to a definition of ‘on demand meaning ‘immediate or as soon as possible’ rather than ‘Demand Responsive’ in the sense of being a service that doesn’t follow a fixed route. One of the problems for DDRT is that it can easily be taken to be offering both these quality parameters, which in fact are very difficult to match economically and operationally for vehicles catering for more than individuals, or very small, connected groups of shared users, rather than promising to respond to and consolidate random requests, however good the digital scheduling systems are.
Though not yet profitable themselves, the TNC firms have, if nothing else, transformed the market for this software, which can be delivered via the cloud more cheaply, and administered remotely without the need for extensive training and specialist staff. Advances in technology have brought more suppliers into the marketplace and in the last few years several new start-up businesses in some ways akin to the TNCs have entered the UK and targeted DRT for use of their service systems. In some cases, these digital systems suppliers and management companies have teamed-up with an existing bus operator to offer the DDRT service. In others, the local authority has partnered with the Software-as-a-Service supplier while still operating the vehicles in-house or via contracts they themselves place with operators. The digital transport service suppliers have marketed DDRT as a ‘smart’ technology solution to providing public transport where fixed scheduled services require significant central or local government support, i.e., at no greater cost but supposedly better service. In some cases they have claimed to make cost savings, an attractive proposition to local authorities facing budget constraints, though the financial equation has often been less than transparent, and the language of’ viability’ and’ value for money’ loosely used. There meanwhile appears to have been both a ‘bandwagon’ and ‘FOMO’ (Fear Of Missing Out) effect, led by commentators and politicians asserting that ‘DRT is the future’, though underpinned by little evidence or experience.
The actual performance of the new tranche of DRT
The problem is, DDRT has not delivered on what its advocates have promised, and most of the ‘new era’ DRT schemes launched since the end of the pandemic have been withdrawn, or are likely to end soon, as funding expires. A review by Roger French (a bus innovator and commentator) of more than 50 DRT schemes introduced in the UK between 2016-23 found that potentially more than £100m of public and private sector monies had been allocated to schemes of which many had failed or been withdrawn (French, 2023), as featured in Local Transport Today magazine (Issue 868, May 2023), and on TAPAS. Available evidence points to very low levels of use and per passenger subsidy at around £4 a trip, which is greater than fixed route services that some have replaced, and in many cases a lot higher due to average loads of just one or two people in the 12-20 seat minibuses generally used.
Meanwhile, an overview of 42 DDRT schemes by TAS Partnership, a specialist public transport consultancy, found that trip productivity across service BROH (Bus Revenue Operating Hours) is low, with an average across all services of 2.38 trips per vehicle operating hour [2.15 across 30 ‘rural’ services and 2.96 across 12 ‘urban’ services], with the lowest at 0.41 trips/vehicle hour and the highest at 4.61 (TAS Partnership, 2023). The four services that are the most productive (>than 4 trips/vehicle hour) are all urban services.[3] The generally low productivity has clear financial implications. If the average passenger trips per vehicle hour is 2.38, even with a fare of £3 and no discounts, this provides a predicted income of £7.14 per vehicle hour - a significant shortfall set against typical hourly costs of provision (~£20-30 per hour). They summarised the current position as follows:
“There is as yet no professional corpus of knowledge available to guide the process of identifying the appropriate locations and circumstances where DDRT may be cost-effective”.
The only DRT operations that still exist securely are those that continue to be subsidised by public funds such as the fflecsi schemes in Wales, or through the DfT Bus Service Improvement Programme and Rural Mobility Fund in England. Much of this support is time-limited and means the other surviving DRT services face a very uncertain future.
Why has this been the disappointing outcome? Is it because the technology has not lived up to the hype from the system suppliers, or is it because DRT comes up against some fundamental laws of journey scheduling and passenger-carrying capacity that are out with technical solutions? The next section ventures to answer this question.
DRT Scheduling: Theory and Practice
Vehicle scheduling for logistics and passenger transport has a long history with the objective of minimising travel times using Travelling Salesmen and shortest path methods (Raff, 1983). The use of computers in D-a-R scheduling was pioneered at the Massachusetts Institute of Technology and in 1971 an algorithm was developed and subsequently used in the Haddonfield D-a-R system in New Jersey.
An algorithm is a set of rules which describe the limits within which an optimum solution to an allocation problem is feasible. These limits, or constraints, can be valued and computed using techniques such as matrix algebra and linear programming to discover whether an efficient allocation is feasible or not. In DRT systems, the scheduling algorithm assigns each trip to a vehicle after examining the prospective routes of all active vehicles to determine the best assignment. Efficient use of the vehicles and the level of service provided to the customer are related to how well the scheduling is done. When a request by a customer is made, the algorithm selects the appropriate vehicle with the best assignment; subject to specific constraints that must not be violated based on:
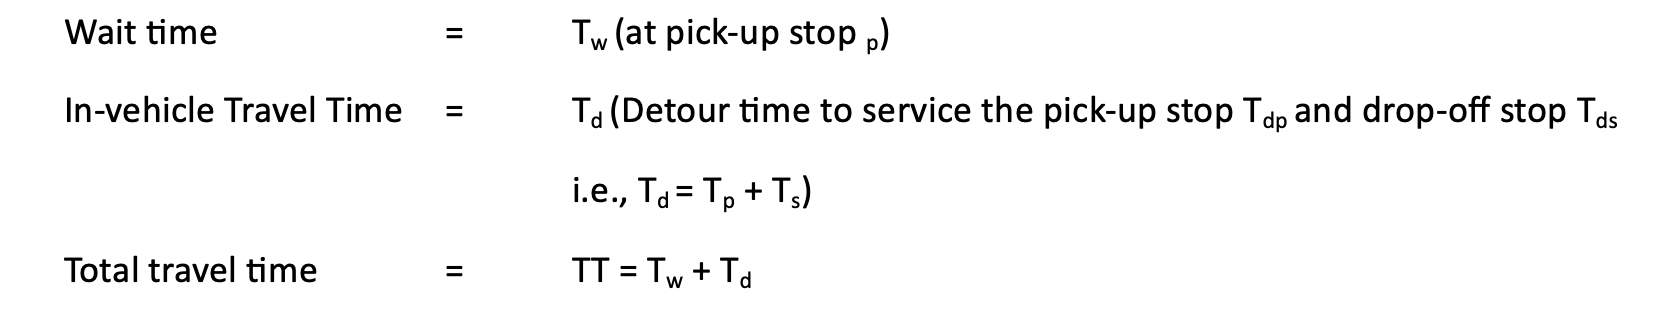
These constraints are system parameters that are set by control room staff prior to and during D-a-R operations. For example, the waiting constraint (Tw)is set to 20 minutes and the detour time (Td) to 15 minutes. Different service levels may be set for different operating periods (peak vs off-peak) or different areas depending upon local geography (area covered).
In practice the optimal selection involves a trade-off between:
-
The increase in the length of the tour of the vehicle;
-
The increase in the delivery times for customers already scheduled; and
-
The delivery times for customers being scheduled.
The algorithm objective is to obtain the lowest waiting times and travel times for the customers using a fixed number of vehicles. In mathematical notation, the objective function (Z) is expressed as follows, with the parentheses separating the three criteria mentioned above.
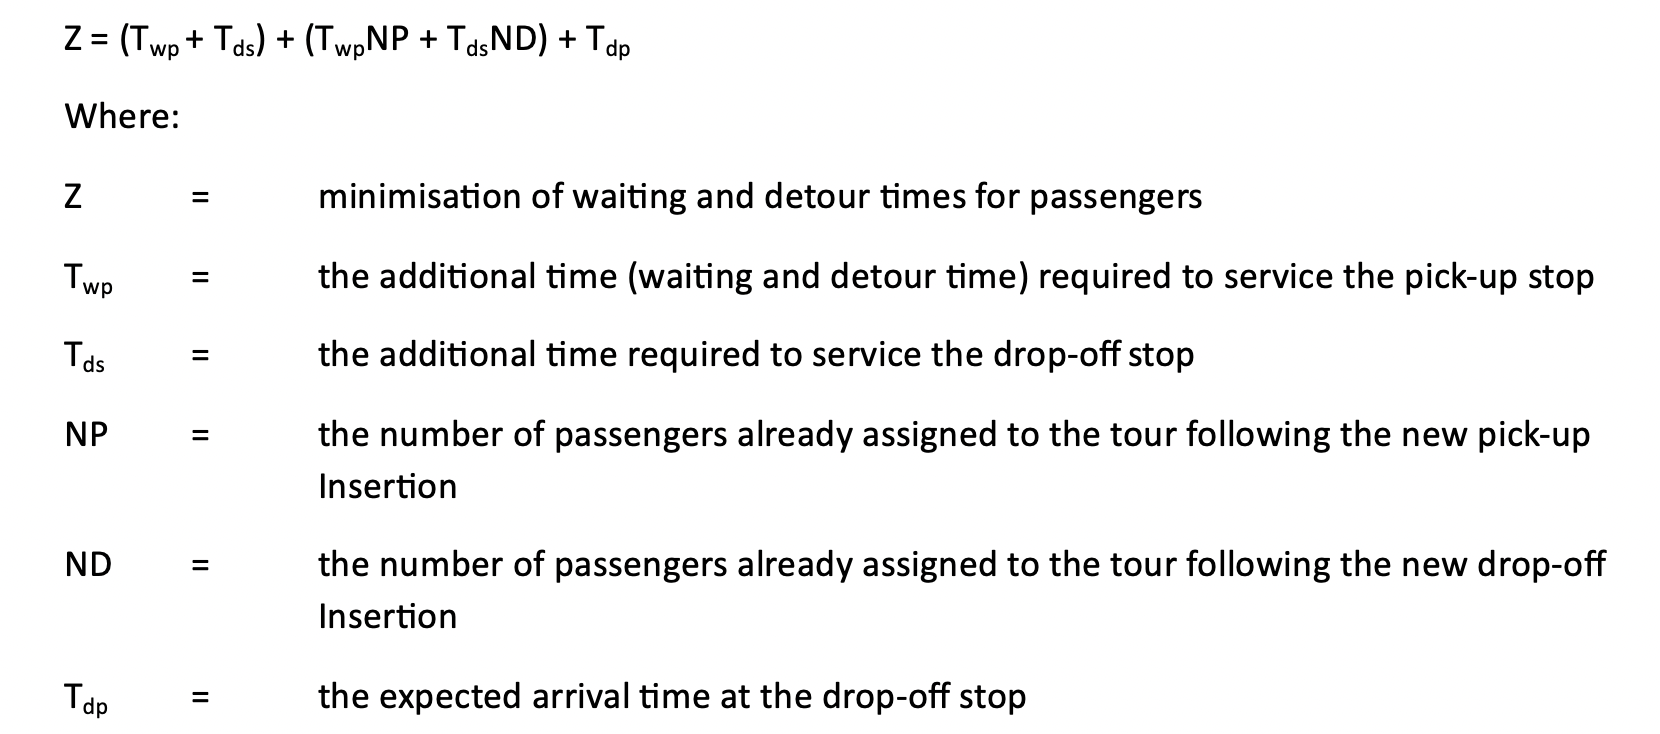
The algorithms used in the first phase D-a-R schemes produced a more efficient schedule within the constraints applied and once a route has been selected between several origins and destinations, the vehicle cannot be detoured to pick-up extra passengers, i.e., fixed allotting algorithm.
The fixed allotting algorithm uses linear programming techniques to find the optimal solution, but later DDRT systems algorithms allow for dynamic insertion to a route by making provisional allotments of requests, which are reassigned in the case of a changed situation (dynamic allotting algorithm). It is the increase ‘power’ of the dynamic allotting algorithm which enables the computer to allocate passengers to vehicles, continuously searching for a more efficient route. The best insertion of a new trip is selected by a criterion using a disutility function (cost function) minimising the increase in total travel time and waiting time of all passengers by a new insertion (minimise Tw + Td).
The following examples illustrate the operational difference between the two algorithms using the notation below:
p(i) = pick-up passenger (i)
d(i) = destination of passenger (i)


Possible solution of direct fixed allotting algorithm
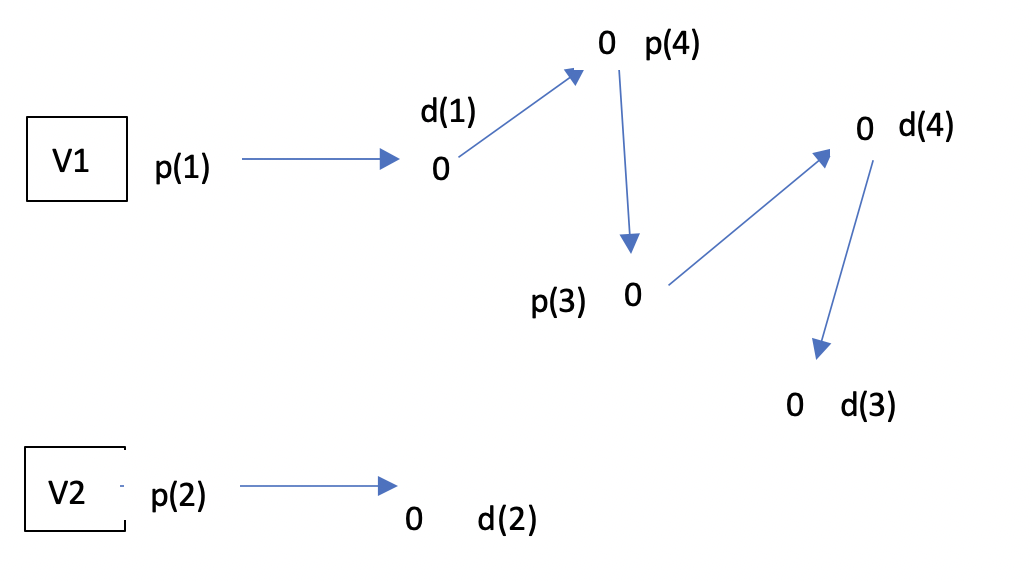
Solution of Dynamic Allotting Algorithm
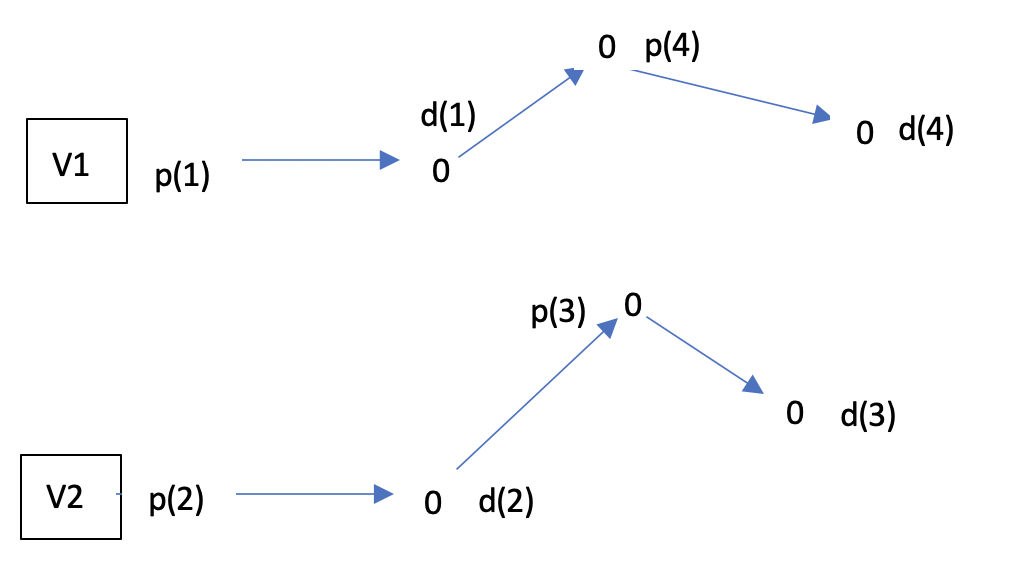
Research and practice have demonstrated that the dynamic allotment algorithm provides a more efficient optimal solution (Breuer et al, 1974; Breuer and Verdonck, 1978). They also have the capacity to manage more trip demands including those requested at short notice and therefore deliver a more effective performance.
Even so, as recent experience has shown the performance of DDRT is not much better than earlier D-a-R systems. This is a consequence of the trade-off between waiting time (Tw) and detour time (Td) for all passengers on the vehicle tour. A hard constraint on these parameters limits the number of passengers that can be carried on any tour, while specifying no constraint can lead to long waiting and detour times for some passengers who may not then accept the booking, or if they do, subsequently become ‘no shows’. DRT wish to maximise the number of passengers per hour but if this results in excessive travel times the demand will fall. Some systems therefore apply a soft constraint which allows flexibility within acceptable limits.
Figure 1 is a simulation of the application of soft constraints in the BUSTAXI scheme in the Netherlands at various levels of demand and the effect on waiting and detour times. It illustrates how higher productivity, as measured by the busload factor, is possible for a given 400 demands per hour, but only at the expense of higher time penalties for passengers. At the optimum number of 20 BUSTAXIS the busload factor is 2.5 and passengers per hour per vehicle is equal to 20. This low productivity rate can be improved by using fewer vehicles, but the wait time and detour time increases exponentially.
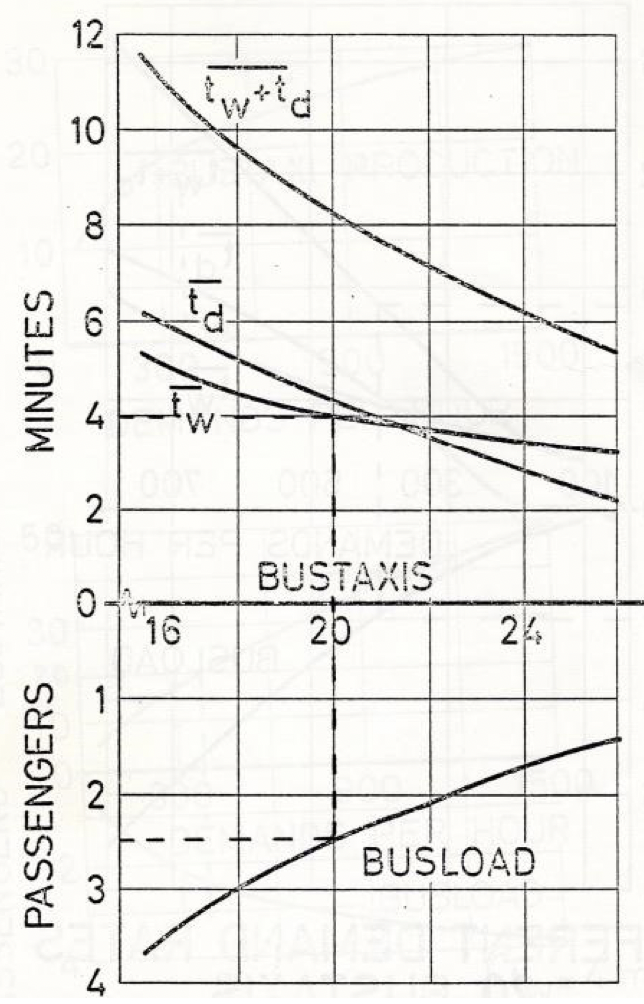
Figure 1. The BUSTAXI Dynamic Allotment Algorithm with Soft Constraints: Simulated Busload Factor and Average Waiting and Detour Time at 400 Demands/Hour.
This example simulates a many-to-many scheme operating in an urban area with high density of population and corresponding high network density of potential route connections. The predicted average total wait time and detour time of 8 minutes is reasonable, yet the experience of most DRT schemes is that the time windows for the wait and detour (delivery) times exceeds this by some margin. Higher total travel times make the DRT less attractive, especially if they offer few advantages over fixed scheduled services.
One method to enhance the busload productivity is deliver a many-to-few service, as previously noted. Several of the UK schemes have implemented this mode of operation by focusing on corridors with known attractors or connecting to hubs. In this way they aim to shift the busload factor and total travel time curve to a more favourable performance. Another technique is to reduce detour times by designating pick-up points that passengers walk to rather than allow door-to-door transport (except for those with mobility restrictions).
Potential Solution of Dynamic Allotting Algorithm in Many-to-One Scenario

In terms of the comparison with the Uber/Lyft TNC business model discussed earlier, those companies’ offer is predicated on their ability to route the working ‘tours’ of their passenger cars for individual hire efficiently, and continually improve their services by learning from the metrics collected as their service is deployed. If larger ‘shared ‘taxi type vehicles are used (as in Uber X, Uber pool and Lyft) there are limits to what can be achieved without compromising the journey quality/cost for the customer. And this situation is again obviously very different for ‘tours’ designed for small loads and higher fares (particularly set by distance) in the ‘taxi’ market compared with the ‘bus equivalent’ offer of DRT at set fares, with the additional burden of providing larger minibuses which are more costly and usually nowhere near full. Indeed, given the scheduling constraints, they could not be and still provide an attractive service to all users in terms of waiting and journey times.
There is another constraint that can impede the efficient delivery of route schedules, namely local geography and specifically the network geography that determines the density of potential route connections. Graph theory – analysing network connectivity as a graph – and nodal accessibility analysis demonstrates that route choice is a function of the number of paths possible to navigate from an origin to a destination. In a DRT operation the order of promised pick-ups and drop-offs constrains the possible pathways as described earlier. This is even more complex if new trip insertions are made during the vehicle tour, which requires re-calculation of the optimum route to service all the pick-ups and drop-offs. The number of permutations can be exceptionally large in a dense network such as an urban area. In lower density areas the number of permutations is related more to the area covered and the distances travelled.
Figure 2 presents a simple graph of the potential network distances measures. Each trip can be component of two distance measures:
The shortest distance (s) = √(x ̇^2+γ^2 )
The square distance (d)=x + y – sometimes referred to as the Manhattan distance
The difference between these two estimates is calculated as the increase (p) between the shortest distance (s) and the square distance (d), i.e., p = 1.41. As shown in Figure 2 the actual route taken will fall somewhere between the shortest distance and the square distance. Analysis of actual route data has shown that, as expected, with longer distances the shortest distance measure approximates closer to the actual distance. In contrast, over shorter distances we might expect the Manhattan distance to be more accurate. In practice, where the actual route lies in the range between 1.0 – 1.41 depends on the network paths available and the order of pick-ups and drop-offs, but data from urban D-a-R schemes indicate that it rests around 1.22 for journeys of less than 10 miles, which is close to the mid-point between the shortest path and the square distance.
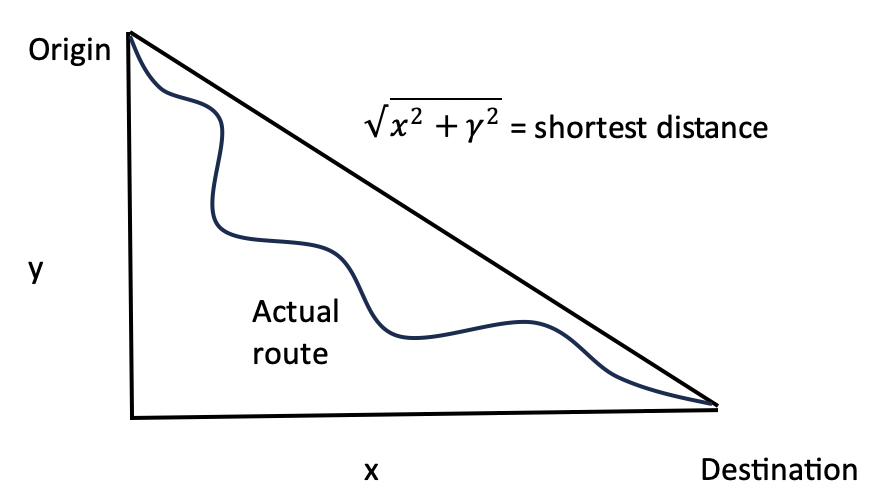
Figure 2. Potential Distance Measures for Transport Operations
The network geography is linked to the waiting and detour time and is another variable that constraints the operation of any DRT scheme, irrespective of the technology applied to the scheduling algorithm.
Can DRT do better?
The evidence to-date suggests that DRT productivity levels are low because there are so many variable factors that need incorporating into the operation which makes providing an efficient service problematic. Advocates of DRT acknowledge their operational challenges but still appear to consider them a worthwhile transport option in places where conventional bus services are absent or in decline, an approach which has appeared to be endorsed by the UK Department of Transport in its official guidance buses (DfT, 2022). For instance, the latest Dft Bus Policy BSIP guidance (2024) takes a slightly more pragmatic line in stating
“Having classified and mapped the service level offered by the fixed route network, the areas which cannot be served by fixed bus routes at an acceptable cost per passenger trip should be identified and mapped. These are areas where creative and innovative alternative non-fixed route provision (including but not limited to demand responsive transport) is appropriate.” (DfT, 2024).
Given all this contextual and operating reality, is it possible to deliver a more efficient DRT service?
Tangible evidence is provided in two studies: one of paratransit services in the USA (Kikuchi, 1987) and another an evaluation of shared mobility costs using uber pool technology (Harmony, 2022). The paratransit case study is from Delaware and uses data collected in the mid-1980s from specialised transportation servicing passengers with disabilities (Figure 3). The results show that as consolidation of passengers increases (i.e., the busload factor rises) the level of service in general declines (as measured by passenger travel speed). Hence, the more passengers accommodated on a journey the greater the time taken to complete the vehicle tour, since each passenger must be embarked and disembarked. In general, it is difficult to obtain a service level higher than on average 25 mph and that it is difficult to get beyond a load factor of 8 passengers for each tour, which at this level is accomplished at an average speed of less than 10 mph.
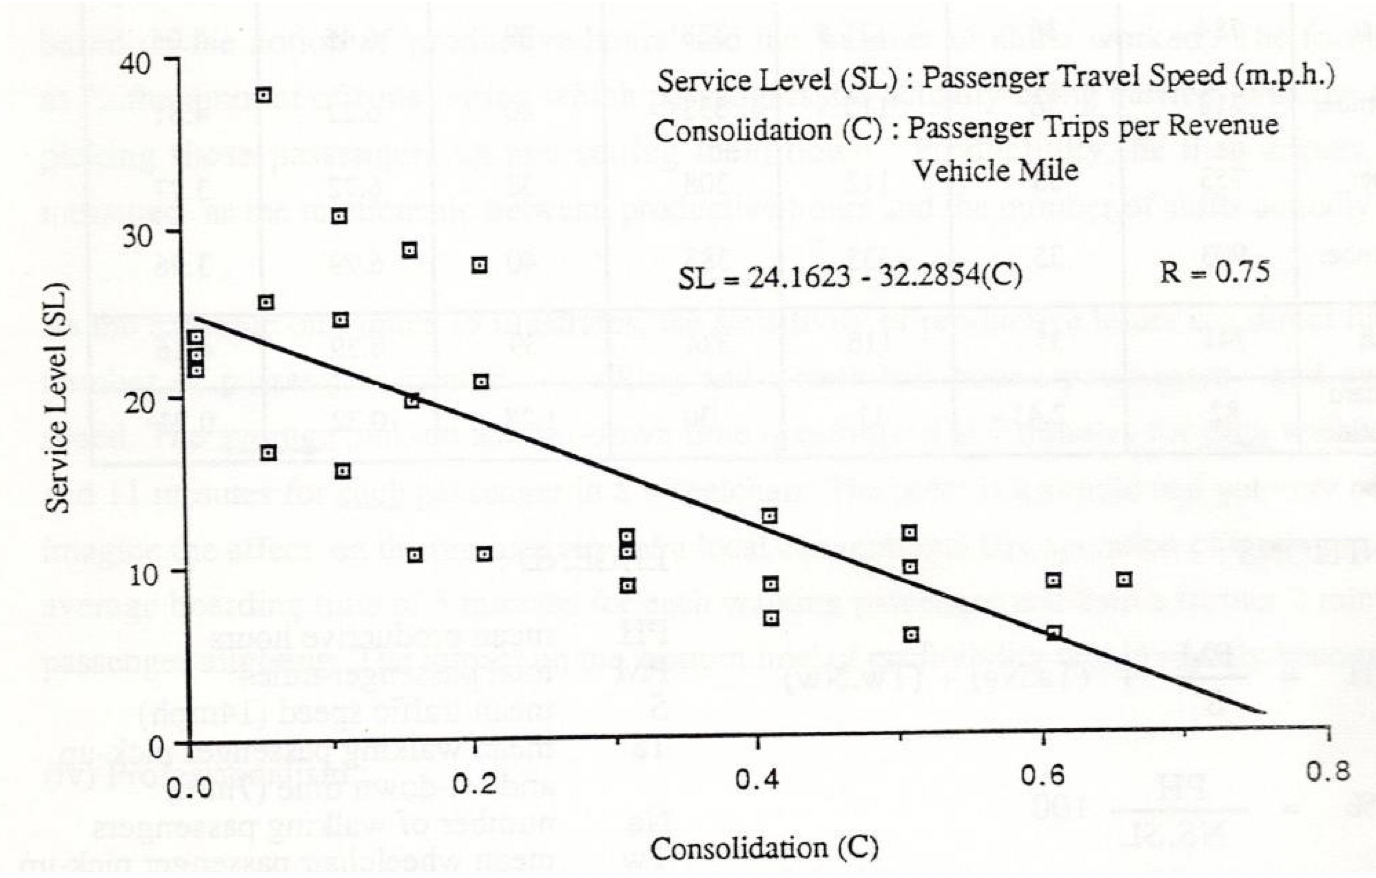
Figure 3. Service Level Performance of D-a-R Schemes in Delaware
DDRT schemes deploying the latest technology claim to be able to improve service level performance by using more robust algorithms linked to GPS to continually update the location and optimise the route while the vehicle is on the tour. While there is no doubt that they have the technology to do this and update the passengers on the expected pick-up and drop-off times, it remains to be demonstrated that they can overcome the geographic and operational barriers to deliver an acceptable level of service from a commercial and passenger perspective compared to fixed route bus services, or expected of taxis or private hires, given the wait time/travel time constraints implicit in the nature of the operations as already discussed.
To test whether shared mobility via the TNCs can offer an economically feasible alternative to traditional transit, data from 1,225 public transit agencies in the USA in 2018 was evaluated against the comparative performance of UberX taxi service and UberPool shared mobility service to determine the conditions under which the latter would provide a cost-effective alternative (Harmony 2022). The analysis uses a TNC – Transit Passenger Equivalence Threshold, measured in passengers per hour (pax/hr), which compares the transit cost per hour with the TNC cost per trip. This gives the passenger breakeven point between the hourly cost of mobility for TNCs and transit. The threshold is the approximate number of passengers that could be served by TNCs before it becomes more cost effective to use transit. The results show that both types of TNC (UberX and UberPool) appear to be more cost-effective when transit systems have low average hourly ridership, typically less than 6 passengers per vehicle revenue hour. In contrast, UberX and UberPool quickly become less competitive as average ridership increases. At an average of just 10 pax/hr bus transit is more cost competitive than UberX 90% of the time and more cost competitive than UberPool 60% of the time with very few TNCs of either type being cost competitive above 20 pax/hr.
As might be expected, the shared mobility version of TNCs (like UberPool) is much more cost-effective than exclusive TNC services (like UberX) but less than conventional bus services when they can survive except, where pax/hr is less than 6, and a conventional bus is very hard to justify. The condition for operating a commercial DRT (i.e., one that charges fares to suit the economics) is therefore limited to targeting the existing market for taxis or those situations where conventional bus services are not available (such as remote rural communities, late evenings and Sundays in lower density suburbs and peri-urban areas), and at taxi like fares (or equivalent subsidies).
The evidence from the USA, at least, suggests that DDRT is only cost-competitive in areas where demand is less than 6 pax/hr, primarily low-density rural or urban fringe locales. The study concludes,
“While TNCs are unlikely to be able to replace transit completely in most cases, at least until vehicles become fully autonomous, their flexibility allows public entities to be more creative when making policy and operational decisions.”
This conclusion resonates with experience in the UK where DRT continues to be championed by the system suppliers and others and experimented in a variety of environments despite the poor outcomes to date.
Local authorities in the UK have been encouraged to trial DRT in areas where significant support for maintaining bus services is required, but available funds are limited, in the hope that the DRT can offer a better service at no more cost, or potentially reduce the subsidy by being cheaper to provide and if generating additional fare revenues. In other cases, the DRT has been deployed where no bus services now exist in order to offer a public transport option to those without access to a car. This seems very unlikely to be possible at a reasonable cost if buses were absent for lack of passengers, or previously carrying only very small numbers.
Given the commercial realities, what are the circumstances that would justify DRT with public support in either scenario?
There may be potential benefits of DRT from a resource use and wider environmental impact perspective (based on vehicle occupancy and carbon emissions per passenger mile versus other modes) and if the users are able to pay a ‘commercial’ fare (or the shortfall be made up by public funding support if perceived as acceptable value for money).
From an economic welfare point of view, the financial support to such services in areas without conventional public transport would potentially be best provided by an agreed support to the payments individual users make to use the service, rather than subventions to the scheme itself. And quite possibly by offering people the choice of using such personal support to spend as they choose on whatever mode they feel best meets their needs, be it private hires/taxis or DRT services.
Meanwhile, if the price was based on vehicle occupancy, this form of mobility could be more sustainable (economically and environmentally) than individual car or taxi journeys. This is likely to be the case in areas where bus services are few and far between so there are few options for travellers. This scenario includes those DRT schemes designed to carry a range of passengers to education, employment and health facilities who otherwise would be entitled to other publicly- funded transport at significant cost. The Call Connect service in Lincolnshire epitomises this approach as does the fflecsi) system in Wales. It may also generate trips for personal business or leisure purposes that otherwise would not be taken, and there is some evidence that a small number of journeys have shifted from the car. Another approach is to charge ‘commercial’ fares for people to reach interchange points for longer journeys by other public transport modes.
Specialised DRT Roles
The above analysis of the role of DRT within the overall transport mix is not to contradict its specialised deployment for user groups whose personal mobility needs are unable to be met by conventional public transport. Dial-a-ride services for those with mobility impairments have been around since the 1980s and enjoy public support and funding often under contract to the local authority or provided more ad hoc by community transport organisations with grant funding from local government sources. The larger and better funded D-a-R services have the resources to use the latest scheduling and management software technologies to seek to continually improve the efficiency of their operations. This also extends to home-to-school transport and adult social care transport which can benefit from more efficient routing and scheduling of their more regular users. Most schemes of this kind do however limit their offer to users to specific days and/or set time windows, rather than providing an ‘on-call’ response. Integrating ‘public’ DRT with specialised transport may further benefit these services if bookings and schedules can be automated and improved so long as conflicts with the times when other passengers require the transport can be resolved.
This concept, of better integrated use of resources, was trialled in several DfT-supported ‘Total Transport’ projects in England (in 2015-17 DfT, 2019) but the experience to date has been disappointing and has failed to deliver a more sustainable service. This is attributed in part to the incompatible operational requirements mentioned earlier, but also by institutional inertia to cooperate on brokerage arrangements for vehicles and staff, and to serve different user groups. In this context, the deployment of artificial intelligence (AI) to create a coordinated brokerage system across multiple service providers may offer scope for the future. In the meantime, we are left with service silos organised to deliver transport to their specific client group which research has found to be wasteful in terms of resource use and suboptimal for many of their clients in meeting their travel needs.
Implementation of the concept of Mobility as a Service may meanwhile also create a specific role for DRT. MaaS- type apps look set to become more popular in urban areas where integrated ticketing and journey planning is feasible across multiple modes, and could include bicycle hire, car hire as well as conventional public transport and shared mobility via DRT/shared taxi services. MaaS aims to encourage more travellers to use public transport and wheeled transport by joining up the legs of each journey to provide as seamless a travel experience, and payment process, as possible. The technology is heading in this direction, but it requires a coordinated approach to transport services integration and some organisation to hold the overall proposition within a viable business model. The best example of the concept in the UK is most often seen as that delivered by Transport for London, which through its franchising and regulatory powers can deliver an integrated public transport system and manage the payments from users of it. If a MaaS- type offer is implemented more widely DRT could potentially have a role to play in the mix of public transport services especially in low density suburban areas, connecting passengers to more regular bus, rail and tram systems, assuming the enhanced overall revenue is seen as worthwhile. A key concept in delivering the Total Journey Planning service that encourages greater public transport use over private cars is the guaranteed ride home, - for example if a service fails to turn up, as well as ensuring connections late in the evening (Sutton, 2015). This is where a shared mobility service like DRT could be of value if the boost it brings to the total usage and spend on public transport is significant.
Conclusion: recognising the realities
The concept of DRT as a flexible form of public transport that can meet passenger needs on demand is an attractive proposition in theory. However, in practice it has failed to live up to the hype and boosterism that often surrounds its implementation. The reasons for its lower-than-expected performance are because of the trade-offs required in delivering acceptable passengers’ travel time in a cost-effective manner without premium fares. The journey time (wait + detour times) constraints mean that routes are optimised with an average of 2.5 - 4 passengers on a tour. At this service level, with bus type fares, the operation is most unlikely to be financially viable. DRT busload capacities can be increased especially where DRT operates in higher density urban areas or the modus operandi focuses on a many-to-few/one model, but the operation still requires on-going subsidy. Research has shown that in those areas where demand is higher, or becomes so over time, it is more cost effective to revert to conventional bus services.
DRT will continue to deliver specialised transport for those with disabilities where the cost of the transport is justified in the absence of a feasible alternative (note, however, that the D-a-R is not always ‘on-demand’ as the level of service may be limited to the budget and number of vehicles available). There also appears to be an emerging potential role for DRT in the delivery of statutory mandated transport by local authorities, where DRT could be integrated with home-to-school transport and adult social care transport (often replacing the contracted use of taxis). Some local authorities have developed a model whereby DRT is provided for additional users in-between the peak times of the statutory services, for instance, 0930 - 1430, supporting local communities especially in remote areas for trips to shops, hospitals, etc.
Finally, there is scope for DRT as part of a total package of integrated MaaS or Total Transport service to provide the ‘last mile’ connections to customers’ origins and destinations in low density areas. The MaaS concept is still in development, but appears to be the direction of travel at least with respect to the technology and the integration of ticketing, etc. The advances in technology have encouraged a number of new entrants into the passenger transport market, epitomised by UberX and UberPool, and CityMapper. These new TNCs are experimenting with new apps and business models to meet travel demands. As yet, they have not been able to demonstrate a feasible DRT service that can compete with buses in terms of fares or busload performance - or at an acceptable per passenger cost in terms of public support. Their overall business viability is also still unproven. New business development looking to commercialise shared mobility is nonetheless on the rise and the TNCs may yet become significant actors in the MaaS marketplace using their entrepreneurial skills and technology to manage the introduction of Total Transport Provision. This is, however, speculative and in any case may be limited to the areas of greatest passenger density, and thus commercial potential. Meanwhile it remains to be seen whether MaaS can be a catalyst for the integration of transport and what role, if any, DRT might play.
As things stand, providing DRT as a cost-effective form of public transport remains problematic apart from the niche operational situations discussed in this article. Advances in technology, such as deploying autonomous, driverless vehicles would be transformational, as might AI that integrates disparate services, but these seem a long way from being delivered anytime soon. Apart from the technology and operational challenges, policy makers need to decide what role DRT should play in the mix of passenger transport services. Is it a shared taxi, a flexible diverting bus service, a catalyst for generating demand for public transport, providing the ‘last-mile’ connection between the home and the local transport hub, or a socially necessary transport system designed for those with special mobility needs? Without clarity over its objectives, ambiguity over its promised prospects will continue to undermine efforts to demonstrate its viability as a public transport service, especially where there is a lack of clear data and full evaluation of the outcomes of DRT projects.
The author would be pleased to hear the thoughts of others with experience of DRT and in particular, with the detail of outcomes of schemes in terms of operational performance, usage and financial outcomes, and any approaches to evaluating value for money.
References
-
Bailey, J. M., Is There a Role for Dial-a-Ride in Britain, Proceedings of Seminar J on Transport Policy, PTRC Summer Annual Meeting, PTRC, 1984, 153-168.
-
Breuer, M.W.K.A., Hendrikse, W.E., de Kroes, J. L., The BUSTAXI, a study of different algorithms for allotting passengers to vehicles, Traffic Control and Transportation Systems, AFCET conference papers, Paris. Pp 109 – 119, 1974. (AFCET is the French Association for Economical and Technical Cybernetics).
-
Breuer, M. W. K. A., and Verdonck, W., RUFBUS, RETAX and BUSTAXI: Three European systems of demand-actuated public transport, Traffic Engineering and Control, June 1978, pp. 287 – 291.
-
Department for Transport, Total Transport: feasibility report and pilot review, July 2019.
-
Department for Transport, Demand responsive transport: local authority toolkit, April 2022.
-
Department for Transport, Bus service improvement plan, May 2021 (updated January 2024).
-
French, R. Can 30 DRT minibuses really hope to successfully replace up to 40 bus routes, LTT 868, 10 May 2023, pp 14 – 20, and TAPAS, 10 May 2023.
-
Harmony, X. Can transportation network companies replace the bus? An evaluation of shared mobility operating costs, Transportation Planning and Technology 2022, Vol. 45, No. 2, 138-158.
-
Kikuchi, S. Development of computerised vehicle scheduling system for specialised transportation: Delaware case, mimeo, University of Delaware, Newark, 1987.
-
Mitchell, C. G. B and Slevin, R., Dial-a-Ride in Britain: experience to mid-1974 and research programme, Transport and Road Research Laboratory, Department of the Environment, Supplementary Report 123UC.
-
Raff, S., Routing and scheduling of vehicles and crews: The State of the art, Computers & Operational Research, Vol.10, Issue 2, 1983.
-
Sutton, J., Transport innovation and passenger needs – changing perspectives on the role of Dial-a-Ride systems, Transport Reviews, 1987, Vol. 7, No. 2, 167 – 182.
-
Sutton, J. Gridlock: Congested Cities, Contested Policies, Unsustainable Mobility, Routledge, Abingdon, 2015.
-
TAS Partnership, Digital Demand Responsive Transport Study for English County Council, January 2023.
-
Oxley, P., Dial-a-Ride in the UK: A General Study, in Symposium on Unconventional Bus Services, Transport and Road Research Laboratory, Report SR 336, UK 1977.
-
Richard Jeremy, Wider thinking can help challenges of DRT, LTT 883 (9 January 2024), and TAPAS, 9 January 2024.
-
Peter Stonham, Innovation needs analysis – so why has DRT had so little? LTT 868 (10 May 2023), and TAPAS, 10 May 2023.
-
Enoch et al Why do demand responsive transport systems fail? The Open University, 2006,
Dr. John Sutton holds degrees in environmental science, urban planning and transport and has more than 40 years of managerial and technical experience. His expertise includes transport planning, research and policy analysis, appraisal, operations (community transport, DRT, local authority transport, bus and rail), information systems and GIS. He has completed assignments in the UK, USA and Asia, including a number of important high visibility projects and leading-edge applications of transport methods and technology. He has a long-standing interest and involvement in specialised and minority modes of transport, and is a member of the Accessibility and Inclusion forum of the Chartered Institute of Logistics and Transport.
He has published widely on transport planning and technology in leading journals as well as three books. His most recent, Gridlock: Congested Cities, Contested Policies, Unsustainable Mobility, was published in 2015. Dr Sutton has worked for a number of major consultancies, and has been an independent consultant since 2009.
You are currently viewing this page as TAPAS Taster user.
To read and make comments on this article you need to register for free as TAPAS Select user and log in.
Log in